Evaluate Object Detector Performance
Evaluating object detection models enables you to ensure their accuracy, reliability, and robustness in real-world applications. Proper evaluation enables effective model comparison, guides improvements by revealing model strengths and weaknesses, and maintains high standards for deployment in critical tasks. Before selecting or deploying a detector, consider your application requirements, such as accuracy, speed, and robustness, and then use evaluation metrics to assess whether the chosen detector meets those needs.
Computer Vision Toolbox™ provides functionalities to evaluate object detection model performance. Interactively visualize detection results using the Object Detector Analyzer app. To evaluate the detection results against the ground truth with a comprehensive set of metrics, you can:
Compute, evaluate, and export performance metrics using the Object Detector Analyzer app. To get started with visualizing and evaluating detection results in the app, see Get Started with Object Detector Analyzer.
Compute and evaluate performance metrics using the
evaluateObjectDetectionfunction.
The evaluateObjectDetection function returns the object detection
metrics as an objectDetectionMetrics object, which encapsulates the evaluation results. If you
are using the Object Detector Analyzer app to evaluate performance, you can export
the computed metrics to the workspace as an objectDetectionMetrics
object. Use these object functions to compute metrics across classes, images, and overlap
thresholds, and create custom visualizations.
averagePrecision— Compute average precision (AP) per class and mean AP.precisionRecall— Compute precision-recall at various thresholds.confusionMatrix— Summarize the true positive (TP), false positive (FP), and false negative (FN) detections per class.imageMetrics— Evaluate performance per image.metricsByArea— Evaluate performance by object area.summarize— Summarize metrics at the data set and class level.
In next sections, you can select the metrics for your application.
Get Started with Object Detection Metrics
Evaluate Detection Matches Using IoU and Overlap Threshold
The intersection over union (IoU) metric in object detection quantifies the overlap between a predicted bounding box and a ground truth bounding box. To calculate the IoU, you must divide the number of pixels in the intersection of the bounding boxes by the number of pixels in their union. You can define an overlap threshold that the IoU between the predicted and ground truth boxes must meet or exceed for the detector to consider the detection a true positive. This makes the IoU essential for objectively assessing the accuracy and quality of object detectors.
If the IoU of a predicted bounding box does not meet or exceed the specified overlap threshold, the detector counts the prediction as a false positive. If a ground truth box does not match to any predicted bounding boxes, the detector counts it as a false negative.
For each predicted object:
True Positive (TP) — A correct detection (IoU with a ground truth box meets or exceeds the threshold).
False Positive (FP) — An incorrect detection (no matching ground truth box, or IoU below the threshold).
False Negative (FN) — A missed object (ground truth with no matching prediction).
True Negative (TN) — Not an object, and no associated, predicted bounding box. This term is rarely used in object detection, as it applies to the background in an image.
To summarize and visualize the performance of an object detector by displaying the TP, FP, FN, and TN counts, create a confusion matrix. To get started, see the Confusion Matrix section.
Select Detection Performance Metrics
When evaluating object detection models, the different metrics you compute provide insights into various aspects of model performance. This table summarizes the most common use cases for each of the typical metrics, and indicates the typical value of that metric for a true positive predicted bounding box.
| Metric | Most Common Use Case | Typical Value |
|---|---|---|
| Precision | Minimize false positives. To get started, see the Evaluate Precision and Recall section. | Greater than 0.8 (80%). |
| Recall | Minimize missed detections (false negatives). To get started, see the Evaluate Precision and Recall section. | Greater than 0.8 (80%). |
| Average precision (AP) at IoU = 0.5 | Summarize precision-recall tradeoff for a single class. To get started, see the Evaluate Average Precision and Mean Average Precision section. | Greater than 0.5 (50%) for challenging tasks, or greater than 0.8 (80%) for high performance. |
| Mean average precision (mAP) | Compare overall detector performance across all classes. To get started, see the Evaluate Average Precision and Mean Average Precision section. | Greater than 0.5 (50%) for standard data sets, or greater than 0.7 (70%) for high performance. |
Evaluate Precision and Recall
Precision measures the accuracy of the positive predictions of an object detection model, defined as the ratio of true positives to all predictions (true positives plus false positives). It reflects the ability of the model to identify relevant objects while minimizing false detections.
A high precision value indicates that the majority of the objects detected by the model are true positives, with very few false positives. For example, a precision value of 1 signifies that all detections made by the model were correct.
Recall measures how well an object detection model finds all relevant objects, defined as the ratio of true positives to the total actual objects (true positives plus false negatives). False negatives are ground truth objects that the model does not detect, or detects with a confidence score below the selected detection threshold (also known as the confidence threshold).
A high recall value indicates that the model detects most relevant objects, with few false negatives. For example, a recall value of 0.9 signifies that the model correctly identified 90% of all actual objects present.
Evaluate P-R Curve
The precision-recall (P-R) plot demonstrates the tradeoff between identifying more true objects and avoiding false detections, providing a comprehensive view of model performance across all possible detection thresholds. The detection threshold is the threshold used to decide whether to accept a prediction from a model as a detection. You can use the threshold to filter out predictions with low confidence scores. By sweeping the confidence score from 1.0 down to 0.0 and plotting the corresponding precision and recall values, you trace out the P-R curve. Use the P-R plot to assess overall detection quality, compare models, or select an optimal threshold based on the needs of your application.
A P-R curve that shows good performance stays close to the upper-right corner, indicating both high precision and high recall across a range of thresholds. While there is no universal threshold for an acceptable P-R curve, a greater area under the curve (corresponding to higher average precision) reflects better performance. The acceptable level depends on the requirements and difficulty of your specific task, but a strong curve for many applications maintains both precision and recall above 0.7 (70%).
This image shows one P-R curve that indicates the model maintains high precision as recall increases, and another P-R curve that shows a model for which precision falls quickly as recall increases. In the latter case, the model cannot maintain high precision when trying to detect more objects.
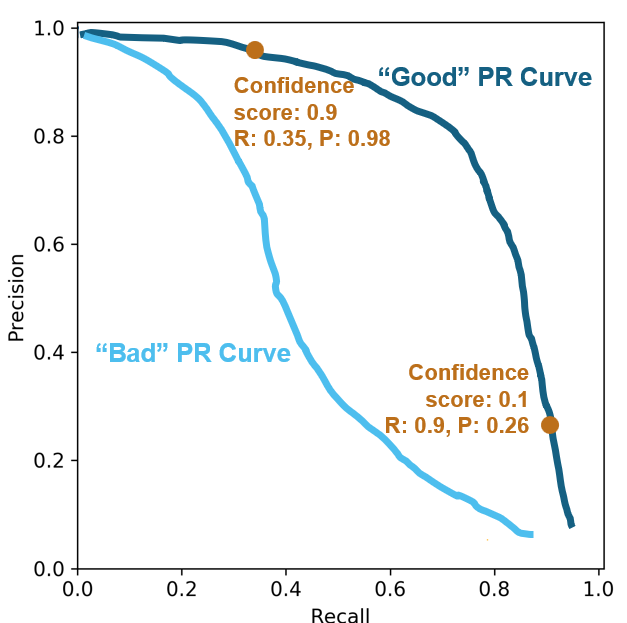
At high confidence scores, such as 0.9, the model counts only the most certain detections, resulting in high precision (few false positives) but lower recall (more missed objects). At low confidence scores, such as 0.1, the model detects more objects, increasing recall (fewer missed objects) but often decreasing precision (more false positives).
Evaluate Average Precision and Mean Average Precision
Average precision (AP) evaluates an object detection model by averaging the precision values for a class across all recall values. Mean average precision (mAP) is a comprehensive metric that averages the AP across all classes of an object detection model, serving as a single value that summarizes both the precision and recall performance of a model across all object categories.
Evaluate Performance Across Multiple Classes
Use mAP when you want to evaluate and compare the overall performance of an object detection model across multiple classes, as it provides a single summary metric by averaging the AP for each class.
To evaluate the detector performance at the data set level, you can average the mAP
over all overlap thresholds. To view the average mAP across your specified overlap
thresholds, use the summarize object function of your
objectDetectionMetrics object, and extract the
mAPOverlapAvg column of the summaryDataset output.
This table shows a sample summaryDataset output of mAP for three
overlap thresholds (0.5, 0.75, and 0.9), and the averaged mAP,
mAPOverlapAvg, over these thresholds.
summaryDataset =
    NumObjects    mAPOverlapAvg    mAP0.5     mAP0.75     mAP0.9
    __________    _____________    _______    _______    ________

       397           0.66020       0.89532    0.59591     0.48926
Evaluate Performance for Specific Classes
Use AP to assess the performance of the model for a specific class. You can compute AP at different IoU values to provide a more nuanced evaluation of the performance of your detector. By calculating AP at a lower overlap threshold, such as 0.5, you can measure how well the model detects objects with loose localization requirements. At higher thresholds, such as 0.75 or 0.9, AP reflects the ability of the model to localize objects precisely. By evaluating AP across multiple overlap thresholds, such as by using the COCO standard average (AP at IoU = [0.50:0.05:0.95]), you can comprehensively evaluate models that are both sensitive and precise. For example, evaluate AP at these common thresholds depending on your application.
| Metric | Usage Scenario | Typical Value |
|---|---|---|
| AP (IoU = 0.5) | Summarize precision-recall tradeoff for general detection and legacy benchmarks (VOC), where rough localization is acceptable. | Greater than 0.7 (70%). |
| AP (IoU = 0.75) | Application that require precise localization, such as robotic grasping or medical imaging. | Greater than 0.5 (50%). |
| AP (IoU = 0.9) | Highly precise tasks, which require strict localization, such as autonomous driving, robotic manipulation, visual inspection, or medical imaging. | Greater than 0.3 (30%). |
| AP (IoU = [0.50:0.05:0.95]) | Comprehensively evaluates both detection and localization accuracy (COCO standard), as well as overall model quality. | Greater than 0.35 (35%) for strong performance. Greater than 0.5 (50%) for excellent performance. |
To view the per-class AP of your object detector, use the summarize
object function of your objectDetectionMetrics object, and extract the
AP column of the summaryClass output. The AP column contains a
numThresh-by-1 numeric vector for each class, where
numThresh is the number of overlap thresholds specified to the
OverlapThreshold property of your
objectDetectionMetrics object.
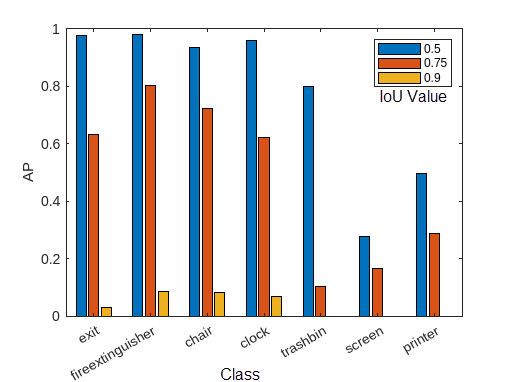
This image shows an example of the AP calculated for each class at three different overlap thresholds. For the full example, see Multiclass Object Detection Using YOLO v2 Deep Learning.
Evaluate Confusion Matrix
Use the confusion matrix to evaluate the counts of true positives (TP), false positives (FP), false negatives (FN), and true negatives (TN) based on the comparison between predicted bounding boxes and ground truth annotations.
You can create a confusion matrix by using the confusionMatrix function. Each column of the confusion matrix corresponds to
a predicted class, except for the last column, which indicates ground truth objects that
the object detector has not detected. Each row corresponds to a ground truth class, except
the last row, which indicates predicted bounding boxes that do not correspond to a ground
truth object. Each element (i, j) of the matrix
indicates the number of ground truth objects of class i that the object
detector has predicted belong to class j. The sum of values in each row
is the total number of ground truth objects that belong to the corresponding class, and the
sum of values in each class column is the total number of predicted bounding boxes that
belong to the corresponding class.
Confusion Matrix
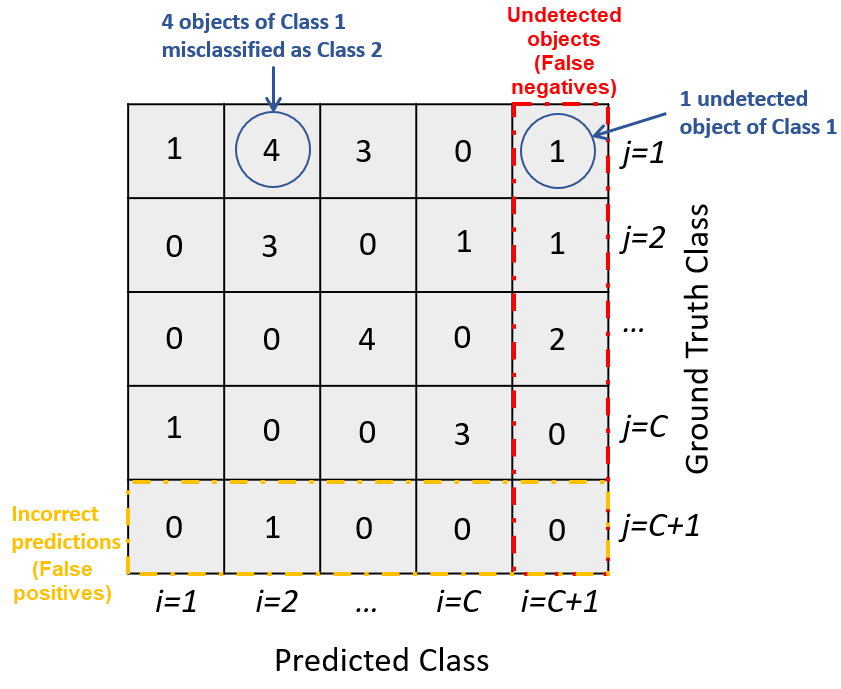
In this sample confusion matrix, you can see that the detector has made no class
confusion errors. Instead, all of the mistakes are missed detections (false negatives) or
incorrect detections in background regions (false positives), such as 10 missed screens and
56 chair false positives.

Note that, while chair has the most errors of any class, printer,
screen, and trashbin have the most errors relative to the amount of
accurate detections, indicating poorer object detector performance for those classes. This
poor performance is likely due to fewer training samples for these classes. For more
information, see Multiclass Object Detection Using YOLO v2 Deep Learning.
Select Detection Threshold
To optimize the performance of an object detector, you must properly tune the detection threshold. If you set the threshold too low, detection results can contain many false positives, while setting it too high can cause the detector to miss true objects. By evaluating metrics such as the confusion matrix and P-R curves at different overlap thresholds, you can select a value that achieves the best balance between precision and recall for your specific application.
This table helps you select a detection threshold tuning approach based on the plot or tool you want to use to evaluate your object detection metrics.
| Metric Assessment Method | Tuning Approach |
|---|---|
| Plot precision and recall against confidence score, per class. | Tune the threshold for each class based on the desired balance between precision and recall. |
| Plot precision and recall against confidence score, per overlap threshold. | Select a threshold that maintains acceptable performance at the IoU required by your application. |
| Confusion matrix | Visualize the tradeoff between types of errors as you adjust the detection threshold, evaluating the counts of TPs, FPs, FNs, and TNs at a specified detection threshold. |
Determine Detection Threshold for Multiple Classes Using P-R Plot
You can use the P-R curve to select a detection threshold by identifying the point where precision remains high while recall meets your minimum requirement. As the detection threshold increases, precision typically rises (fewer false positives), while recall usually decreases (more false negatives), showing the tradeoff between the two. These plots help you choose the lowest threshold that achieves your target recall without sacrificing too much precision, and diagnose whether your model is prone to missing objects or producing many false alarms at different confidence levels. If missing objects is costly, prioritize improving recall; if false positives are costly, prioritize improving precision.
This figure displays sample P-R plots for three classes. The plots show the proportional relationship between precision and recall, the relationship between recall and confidence score, and the relationship between precision and confidence score, respectively. For the full example, see Multiclass Object Detection Using YOLO v2 Deep Learning.
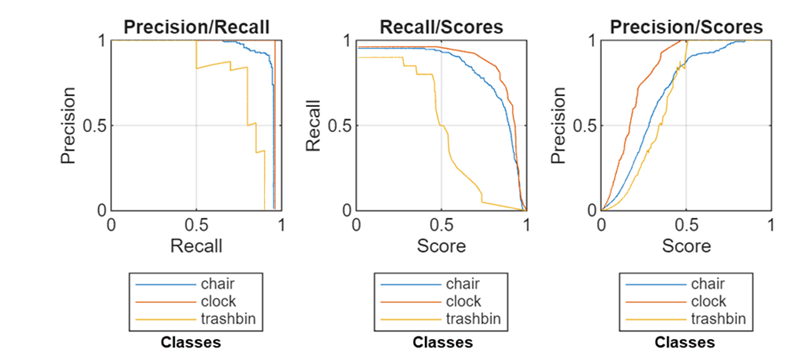
The Precision/Recall plot shows that the
chair class maintains high precision across a wide range of recall
values, while the trashbin class shows a steep drop in precision as
recall increases. The clock class performs moderately, with precision
decreasing more gradually than trashbin but not as well as
chair.
The Recall/Scores plot shows that recall for the
chair and clock classes remains high until the
score threshold increases, after which it drops rapidly. The trashbin
class starts with lower recall and declines steadily as the score increases, indicating
poorer performance.
Assume that you want to achieve a recall value for all three classes of 0.8.
According to the Recall/Scores plot, the detector
achieves this at confidence scores above 0.5 for the chair and
clock classes, but does not for the trashbin
class except at confidence scores below 0.5. This suggests a need for more training
data, better annotations, or targeted augmentation for the trashbin
class. For now, you can ensure that all three classes meet your recall requirement by
using a detection threshold of 0.4.
Tune Detection Threshold Using P-R Plot for Localization
When you need to understand how a detection threshold interacts with the localization strictness defined by the overlap threshold, plot P-R as a function of confidence score for a range of overlap thresholds. By evaluating performance at different overlap thresholds, you can select a detection threshold that provides acceptable results for your required localization precision. For example, if your application requires strict localization with detections tightly aligned with ground truth, plot P-R curves for a range of high overlap thresholds to determine the most suitable detection threshold.
This figure displays sample P-R plots of the chair class for three
overlap thresholds at increasing confidence scores. The plots show the proportional
relationship between precision and recall, the relationship between recall and
confidence score, and the relationship between precision and confidence score,
respectively. For the full example, see Multiclass Object Detection Using YOLO v2 Deep Learning.
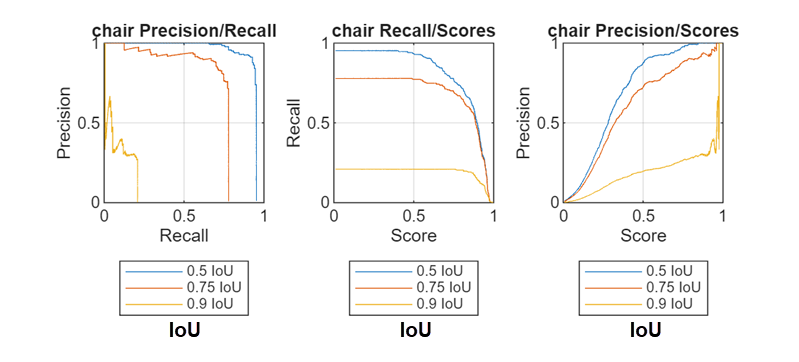
The chair Precision/Recall plot shows that precision decreases as recall increases, while both precision and recall decrease at higher overlap thresholds. The chair Recall/Scores plot shows that recall drops rapidly at high confidence scores, but is never above 0.5 when the IoU threshold is 0.9, even at low confidence scores. Finally, the chair Precision/Recall plot shows that precision generally increases with higher scores, but maximum precision is lower at higher overlap thresholds.
When selecting a detection threshold, you must balance the tradeoff between maximizing recall and maximizing precision, especially for stricter IoU requirements. Choose a detection threshold based on the desired balance for your application. For example, if you require the detector to achieve at least 90% precision (few false positives) when recall is at 80% (most true chairs detected), you can use a detection threshold of 0.4 for this example, which that achieves this balance at an IoU of 0.5.
Tune Detection Threshold Using Confusion Matrix
You can use the confusion matrix to tune the detection threshold by analyzing how the number of true positives, false positives, and false negatives changes as you adjust the threshold. By increasing the threshold, you discard low-confidence predictions, which typically reduces false positives but may increase false negatives. By examining the confusion matrix at different thresholds, you can find a balance where the detector maintains high precision with fewer false positives without sacrificing too much recall and missing too many true objects.
Evaluate Metrics by Area
To understand how well a detection model performs across objects of different sizes, you must analyze detection metrics by area. In many real-world applications, object sizes vary significantly, and a model that excels at detecting large objects might not perform as well on small- or medium-sized ones. By breaking down metrics such as precision and recall by object area, you can identify specific size-related strengths and weaknesses of your model, enabling you to target improvements that ensure robust performance across all object scales.
Use the metricsByArea
object function of the objectDetectionMetrics object to evaluate object detection performance across
various object size ranges. You can compute detection metrics, such as average precision,
recall, and precision, across object sizes by grouping detected objects into bins based on
their areas. To use metricsByArea with object detection results, you
must first create an objectDetectionMetrics object using your ground truth
data and detection results. Then, use metricsByArea on this object to
get a table that contains detection metrics calculated separately for each area bin,
providing a detailed analysis of detector performance across various object size
ranges.
This figure shows the average precision of an object detector for vehicles grouped by their anchor box mean area, which corresponds to vehicle size. AP peaks at 0.999 for vehicles with a mean anchor box area of 2496 pixels, and drops to its lowest (about 0.985) for the largest mean area, 6912 pixels. This shows the model performs best on mid-sized vehicles and least effectively on the largest ones.

References
[1] Everingham, Mark, S. M. Ali Eslami, Luc Van Gool, Christopher K. I. Williams, John Winn, and Andrew Zisserman. “The Pascal Visual Object Classes Challenge: A Retrospective.” International Journal of Computer Vision 111, no. 1 (2015): 98–136. https://doi.org/10.1007/s11263-014-0733-5.
[2] “COCO - Common Objects in Context.” Accessed April 29, 2025. https://cocodataset.org/#detection-eval
See Also
Apps
Functions
objectDetectionMetrics|evaluateObjectDetection|averagePrecision|confusionMatrix|metricsByArea
See Also
Topics
- Get Started with Object Detector Analyzer
- Multiclass Object Detection Using YOLO v2 Deep Learning
- Object Detection in Large Satellite Imagery Using Deep Learning
- Object Detection Using YOLO v4 Deep Learning
- Detect Defects on Printed Circuit Boards Using YOLOX Network
- Choose an Object Detector
- Get Started with Object Detection Using Deep Learning