How to shift the matrix values by a specified function?
Mostra commenti meno recenti
I'm trying to shift the values of a matrix R ('a simple road with heigthened borders') by a function yy ('a curve') in order to turn the straight road into a curved road. Please look at the picture and code below for better understanding. Is there a way to achieve this? I'm at my wits end. Thank you in advance!

% matrix
xlim = 0:0.5:20;
ylim = -10:0.125:10;
[xr,yr]= meshgrid(xlim,ylim);
r = zeros(length(ylim), length(xlim));
ylim2 = -5:0.125:5;
[x,y]= meshgrid(xlim,ylim2);
r1 = (1./(y-5)).^2 ;
r2 = (1./(y+5)).^2;
r12 = max(r1,r2);
n = (length(ylim)-length(ylim2))/2;
r(n:n+length(ylim2)-1, 1:length(xlim)) = r12;
figure
surf(xr,yr,r)
title('R')
% function
xp = [0 10 20];
yp = [0 1 5];
yy = pchip(xp,yp,xlim);
figure
plot(xp,yp,'o',xlim,yy)
title('yy')
Risposta accettata
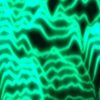
You mean something like this?
% straight road
xlim = 0:0.5:20;
ylim = -10:0.125:10;
[xr,yr] = meshgrid(xlim,ylim);
ylim2 = -5:0.125:5;
[x,y] = meshgrid(xlim,ylim2);
r1 = (1./(y-5)).^2 ;
r2 = (1./(y+5)).^2;
r12 = max(r1,r2);
r = zeros(length(ylim), length(xlim));
n = (length(ylim)-length(ylim2))/2;
r(n:n+length(ylim2)-1, 1:length(xlim)) = r12;
% offset
xp = [0 10 20];
yp = [0 1 5];
yy = pchip(xp,yp,xlim);
yr = yr+yy;
% plot
h = surf(xr,yr,r);
title('R')
view(-97,34)

3 Commenti

Thu Trang Nguyen
il 15 Nov 2021
If you want something like this with very steep features to be represented on an unaligned rectangular mesh, you can try, but it's going to look pretty terrible unless you use a very dense mesh.
You can try to just use interpolation to project the above result back onto the original mesh:
% matrix
xlim = 0:0.5:20;
ylim = -10:0.125:10;
[xr,yr]= meshgrid(xlim,ylim);
ylim2 = -5:0.125:5;
[x,y]= meshgrid(xlim,ylim2);
r1 = (1./(y-5)).^2 ;
r2 = (1./(y+5)).^2;
r12 = max(r1,r2);
r = zeros(length(ylim), length(xlim));
n = (length(ylim)-length(ylim2))/2;
r(n:n+length(ylim2)-1, 1:length(xlim)) = r12;
% offset
xp = [0 10 20];
yp = [0 1 5];
yy = pchip(xp,yp,xlim);
% crude interpolation back onto original mesh
r2 = interp2(xr,yr,r,xr,yr-yy);
surf(xr,yr,r2)

Or you can rewrite everything. If you don't care about clamping for yy+5 < y < yy-5, then
x = 0:0.5:20;
y = (-10:0.125:10).';
xp = [0 10 20];
yp = [0 1 5];
yy = pchip(xp,yp,x);
r1 = (1./(y-5-yy)).^2;
r2 = (1./(y+5-yy)).^2;
r12 = min(max(r1,r2),70);
surf(x,y,r12)
title('R')

Note that r12 is clamped to <70, as values may extend off toward infinity depending on where any given point lands on the mesh.
Or if you want to clamp, you can try:
x = 0:0.5:20;
y = (-10:0.125:10).';
xp = [0 10 20];
yp = [0 1 5];
yy = pchip(xp,yp,x);
r1 = (1./(y-5-yy)).^2;
r2 = (1./(y+5-yy)).^2;
r12 = min(max(r1,r2),70);
r12((y<(yy-5)) | (y>(yy+5))) = 0;
surf(x,y,r12)
title('R')

You can play around with how you handle the near-singular features if you want something different.
Thu Trang Nguyen
il 15 Nov 2021
Più risposte (0)
Categorie
Scopri di più su Cartesian Coordinate System Conversion in Centro assistenza e File Exchange
il 15 Nov 2021
il 15 Nov 2021
Community Treasure Hunt
Find the treasures in MATLAB Central and discover how the community can help you!
Start Hunting!
Translated by 

