Risultati per

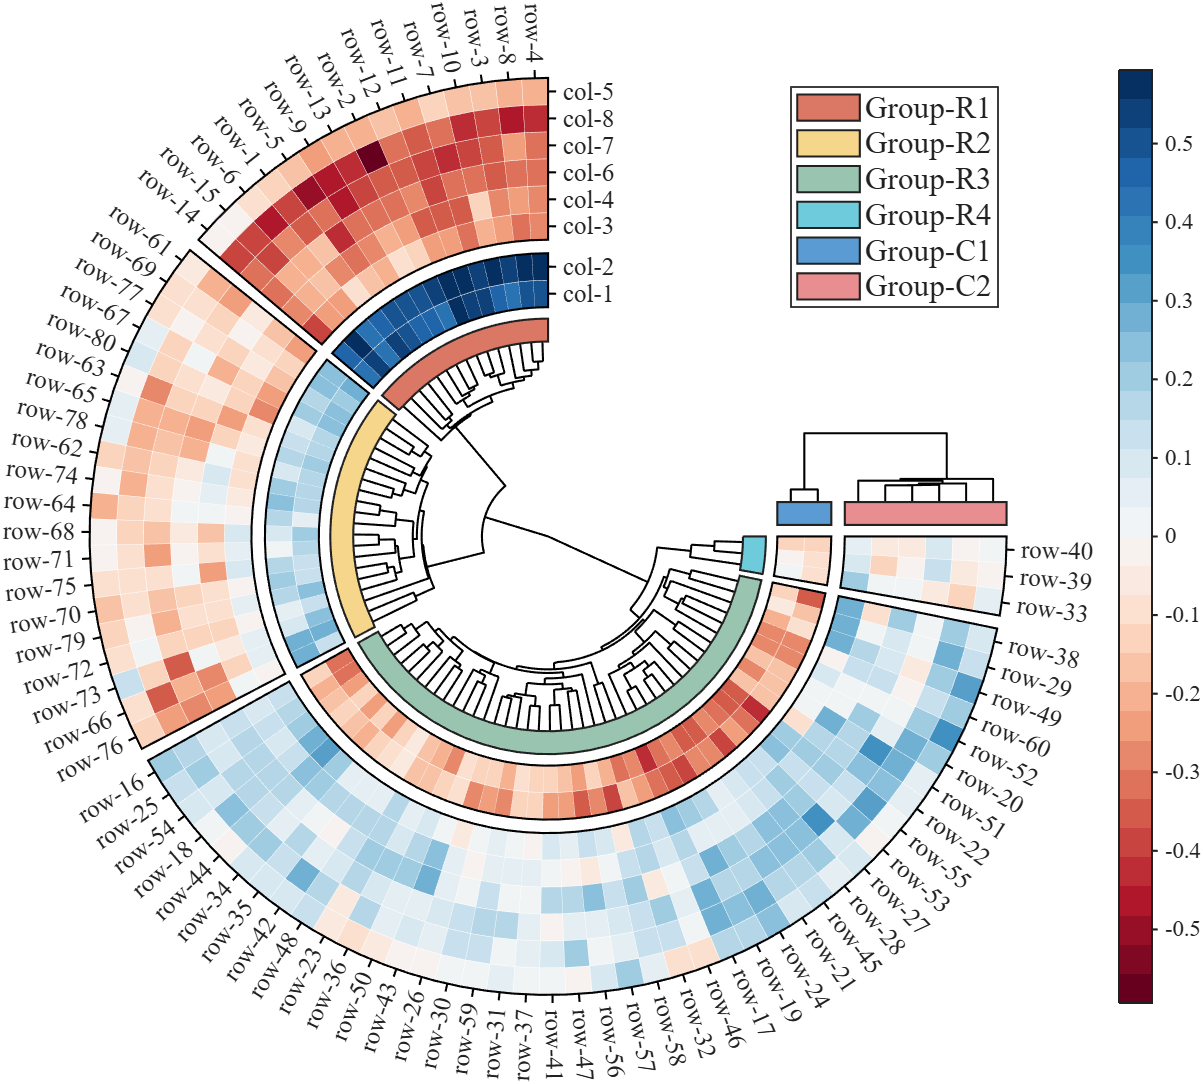
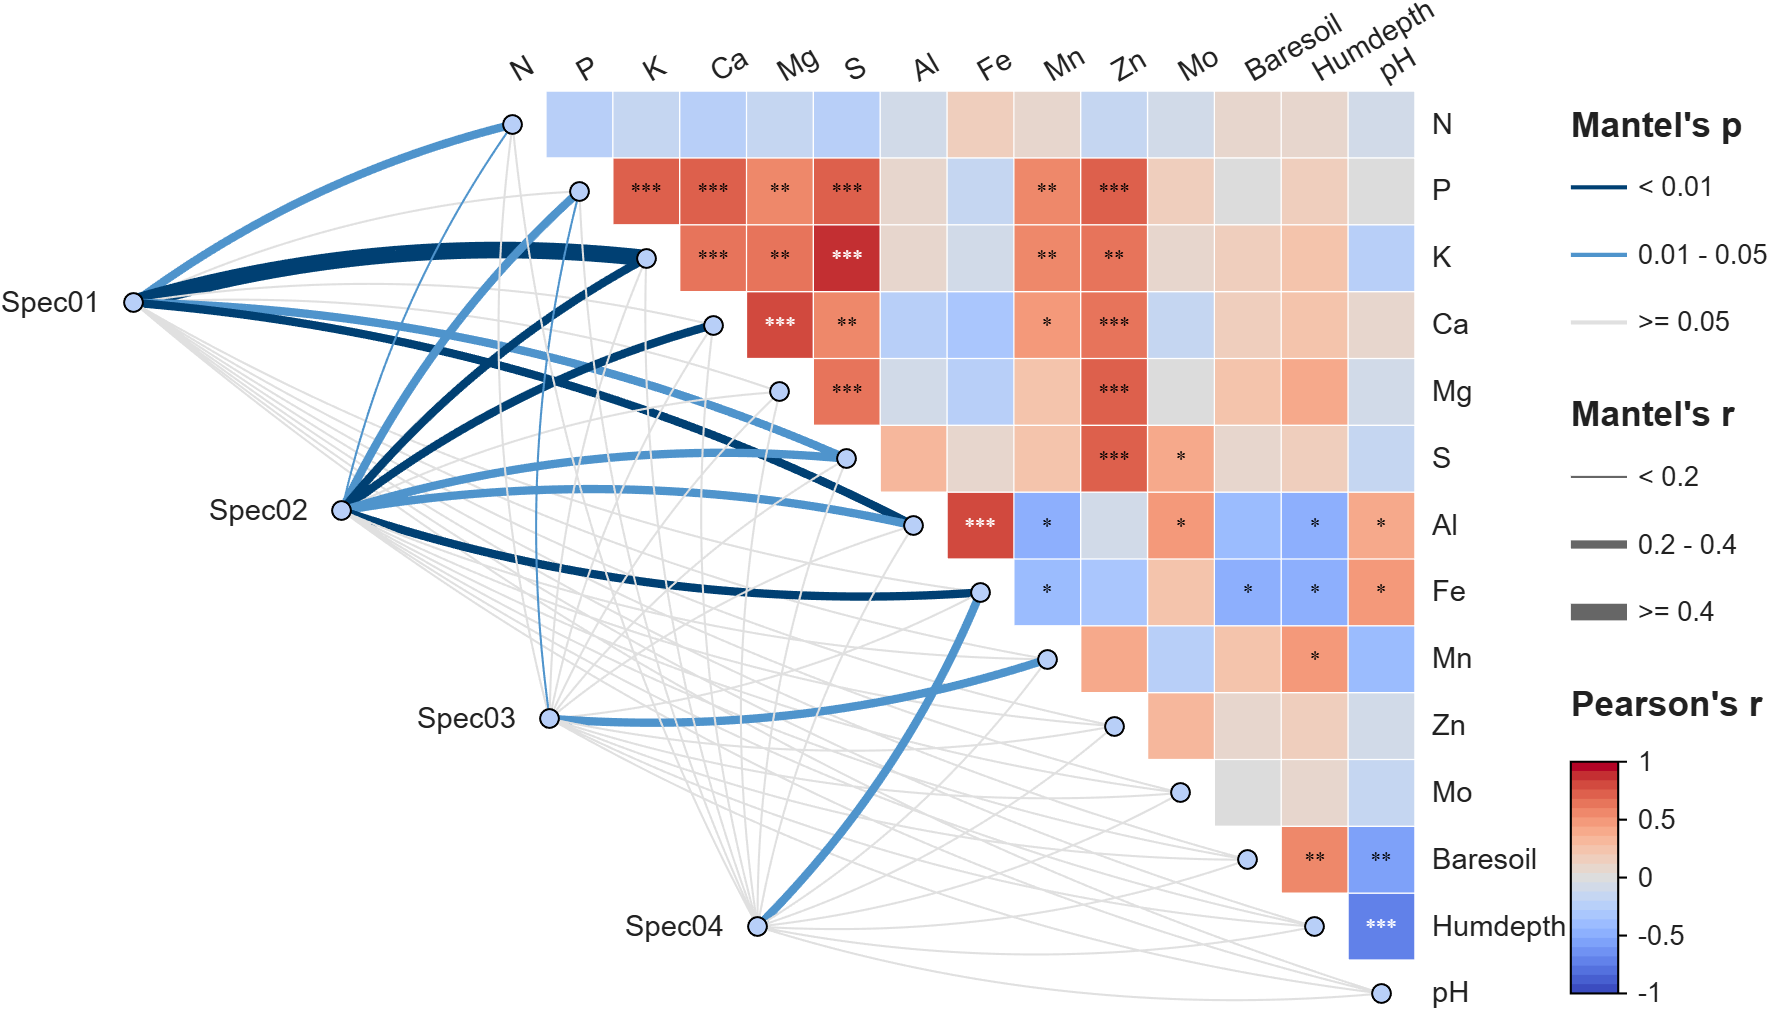
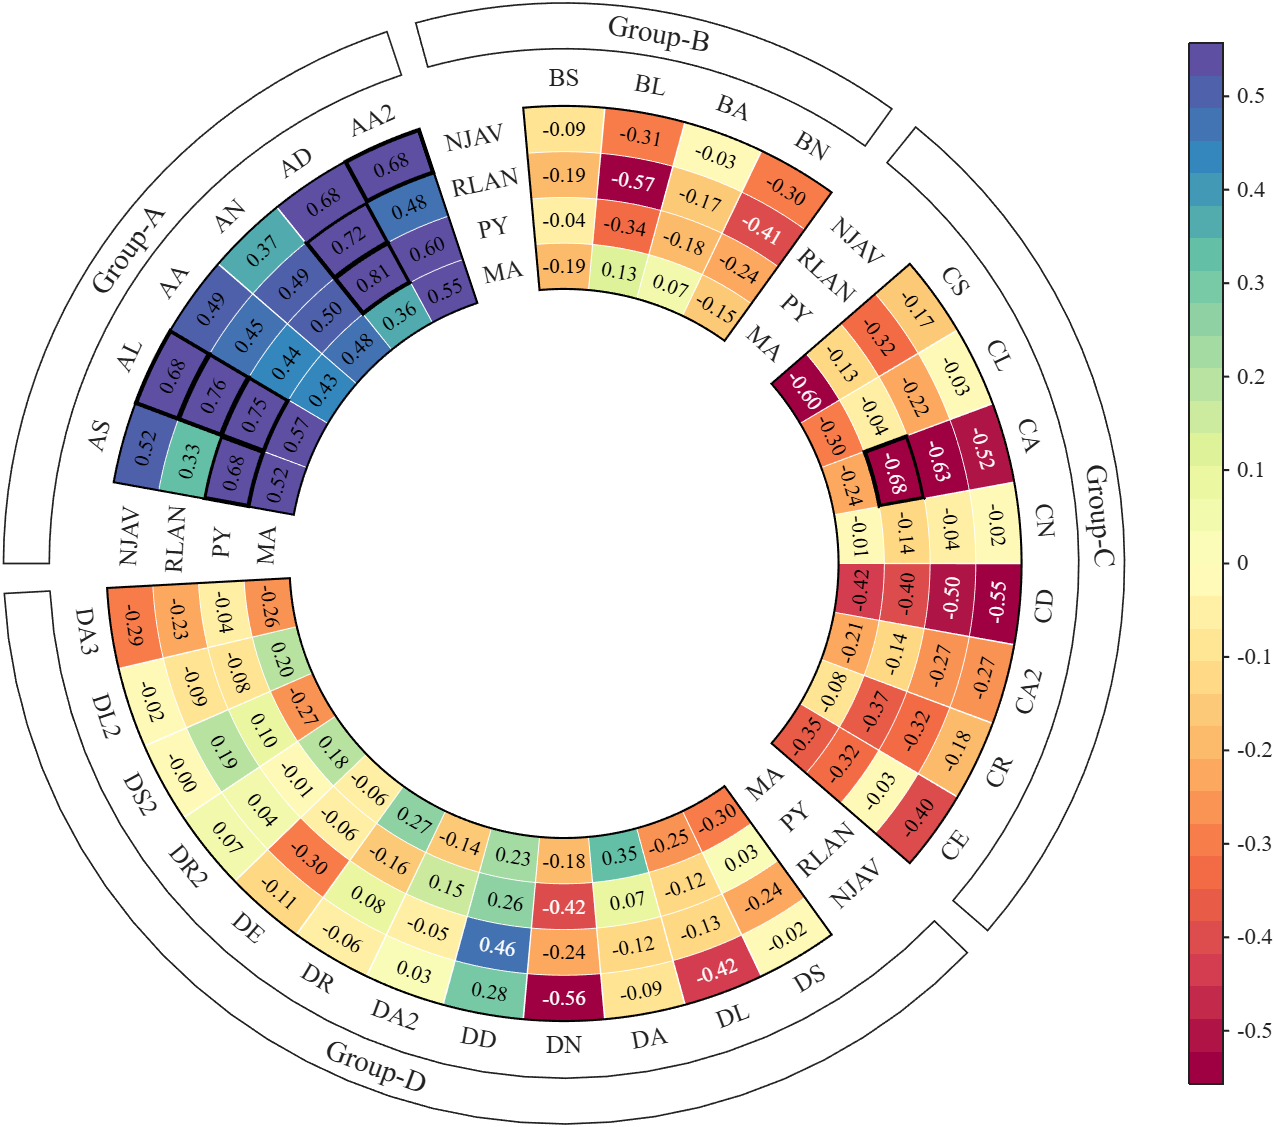
Annular, sector, triangular, and cluster heatmaps can all be produced by this tool:https://www.mathworks.com/matlabcentral/fileexchange/125520-special-heatmap
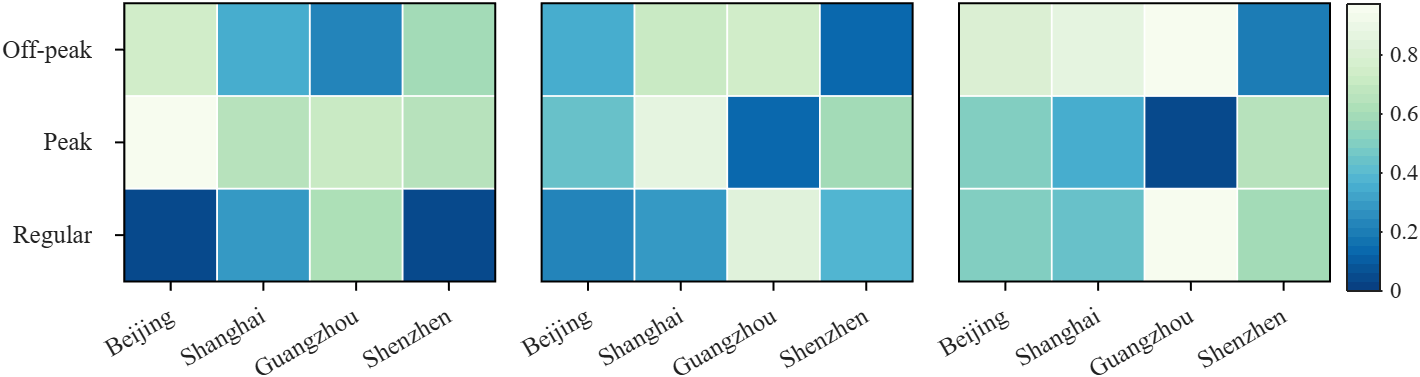
Demo: Group Sep with non-square matrix
Data = rand(3, 12);
SHM = SHeatmap(Data, 'Format','sq');
SHM.RowName = {'Off-peak', 'Peak', 'Regular'};
SHM.ColName = {'Beijing', 'Shanghai', 'Guangzhou', 'Shenzhen'};
SHM.ColGroup = [1,1,1,1, 2,2,2,2, 3,3,3,3];
SHM.draw().setFrame()
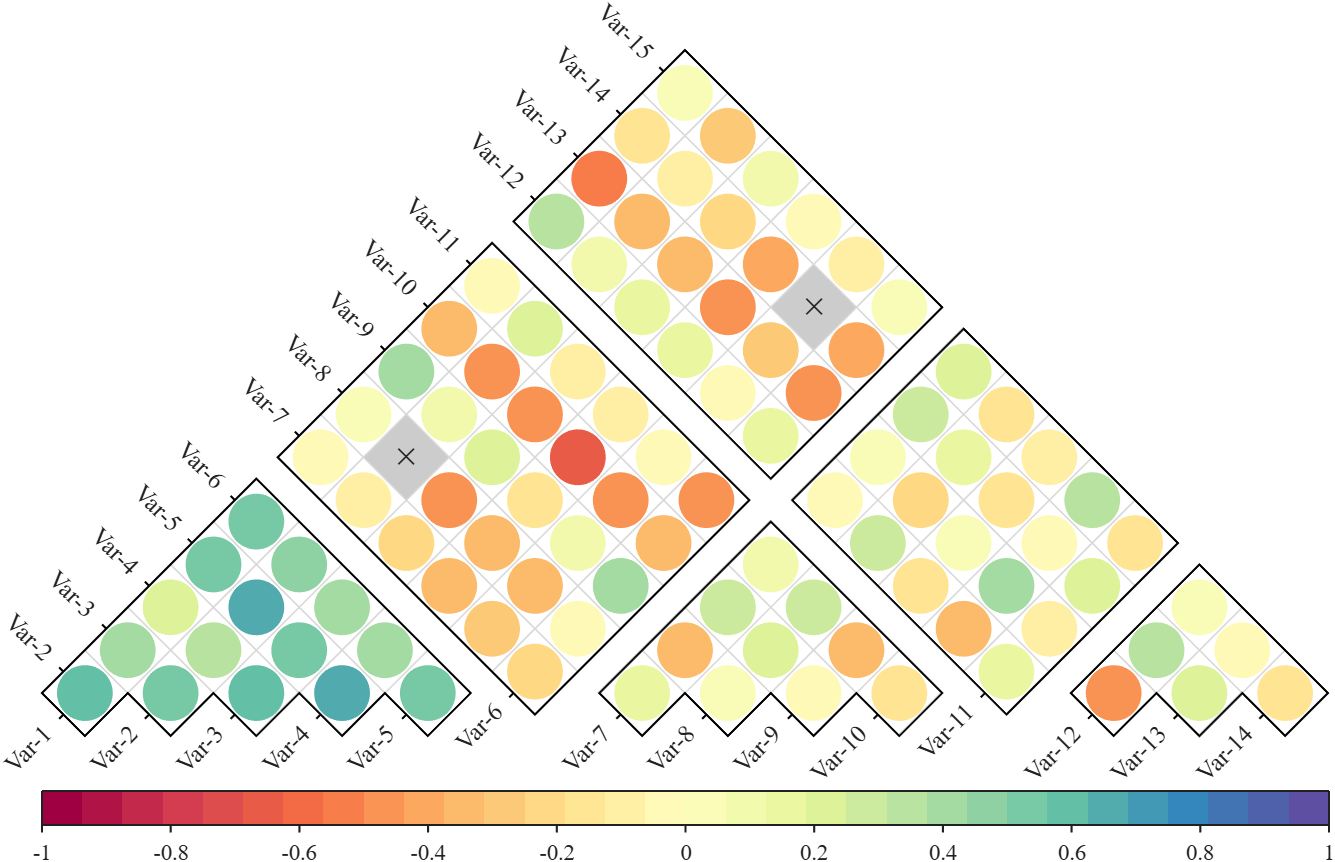
Demo: Merge two triangle heatmaps
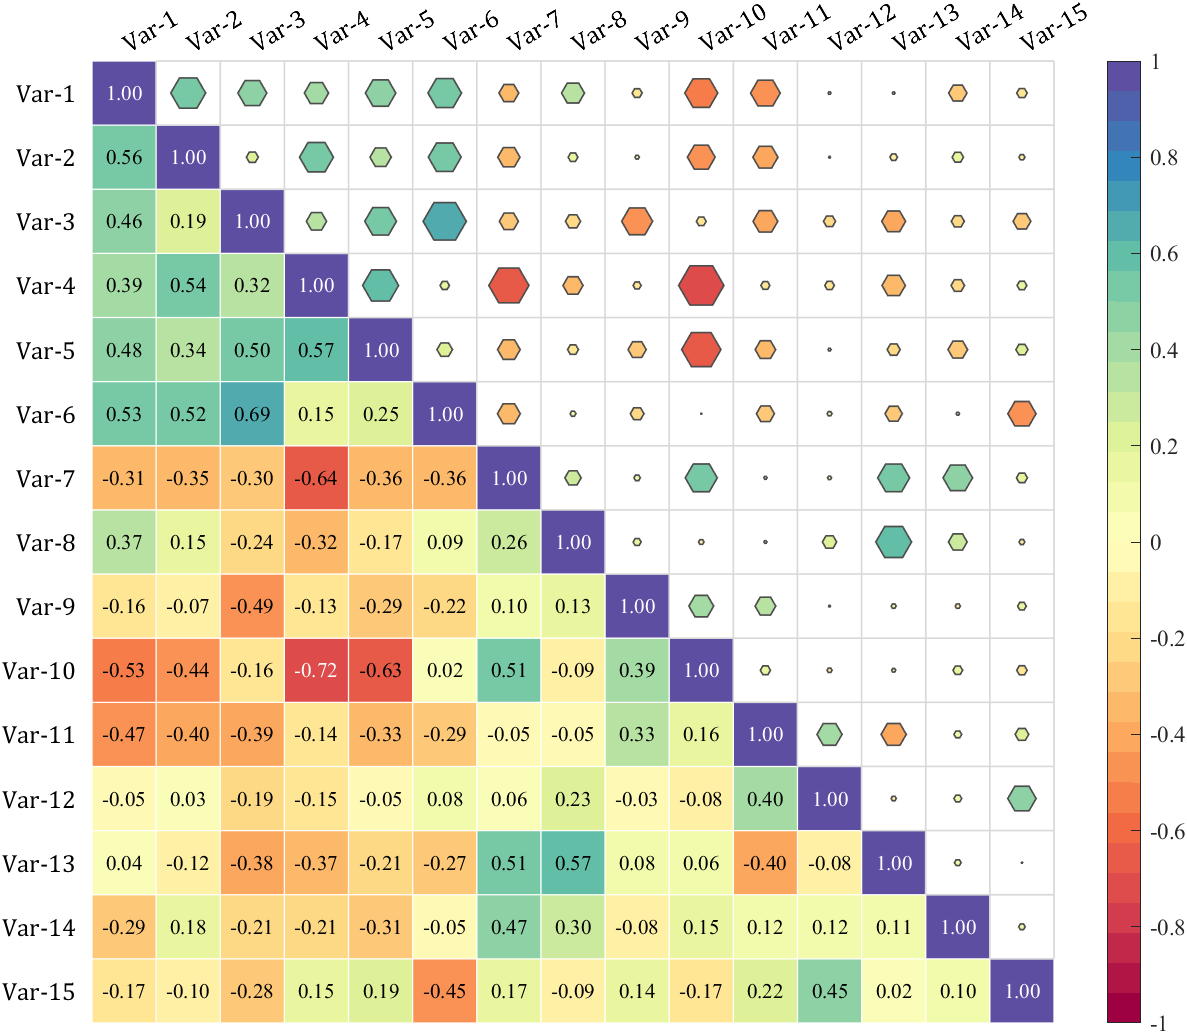
% Made up some data casually (随便捏造了点数据)
X = randn(20,15) + [(linspace(-1,2.5,20)').*ones(1, 6), (linspace(.5,-.7,20)').*ones(1, 5), (linspace(.9,-.2,20)').*ones(1, 4)];
% Get the correlation matrix (求相关系数矩阵)
Data = corr(X);
figure()
SHM_m1 = SHeatmap(Data, 'Format','sq').draw().setType('tril');
SHM_m1.setColLabel('Visible','off').setText()
SHM_m2 = SHeatmap(Data, 'Format','hex').draw().setType('triu0');
SHM_m2.setRowLabel('Visible','off').setColLabel('Visible','on') % Show the hidden Var-1 label (显示隐藏的 Var-1 标签)
Demo: Circular heatmap with Group Block and GroupSep
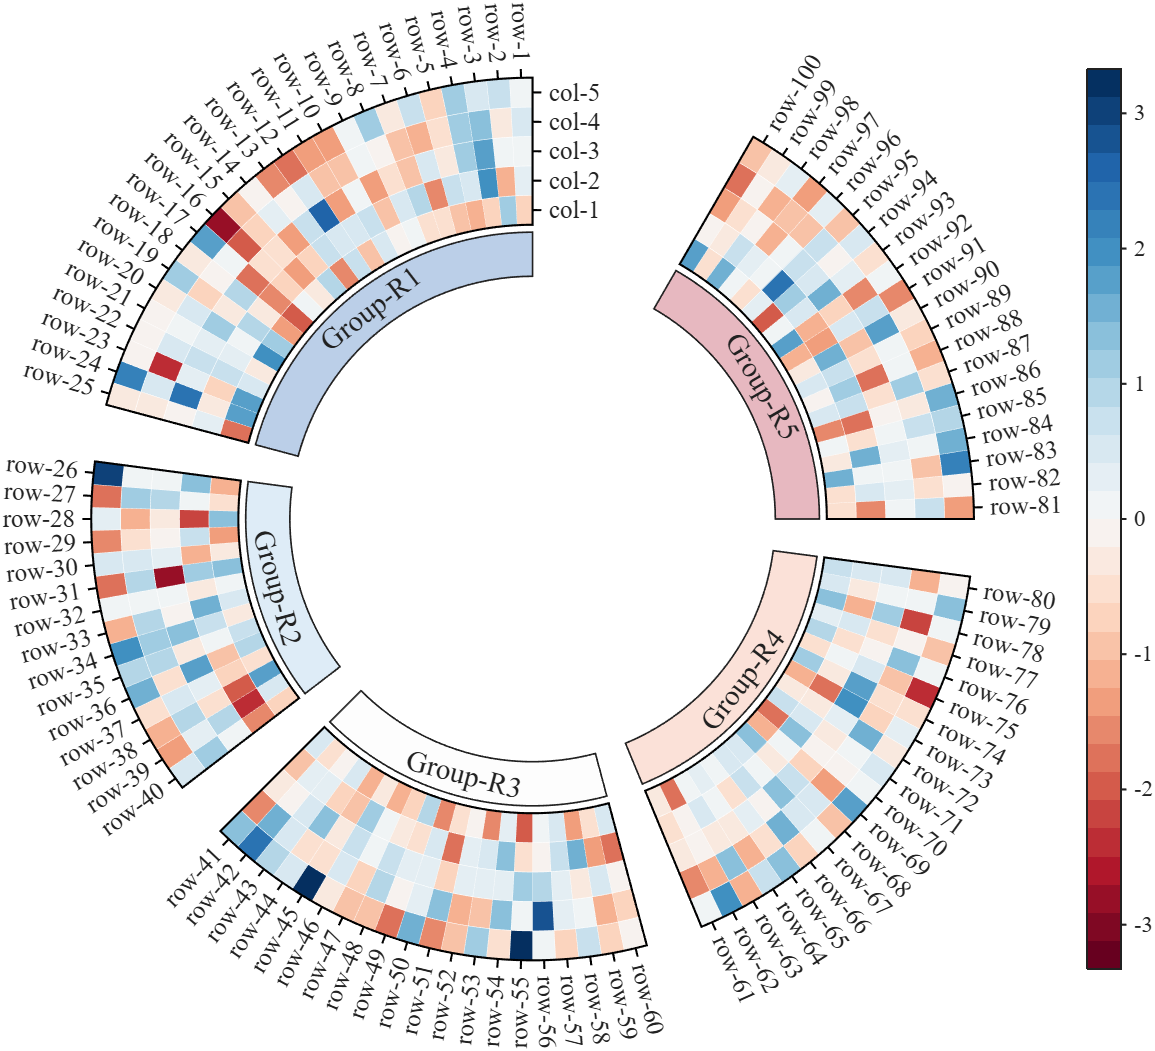
% Circular heatmap is currently supported only for
% SHeatmap with 'sq' Format and 'full' Type.
rng(1)
Data = randn(100, 5);
rowName = compose('row-%d', 1:100);
colName = compose('col-%d', 1:5);
rowGroup = [ones(1, 25), 2.*ones(1, 15), 3.*ones(1, 20), 4.*ones(1, 20), 5.*ones(1, 20)];
rowColor = [187,207,232; 222,236,247; 253,253,253; 251,225,216; 231,184,192]./255;
rgnames = {'Group-R1','Group-R2','Group-R3','Group-R4','Group-R5'};
% create figure (图窗创建)
fig = figure('Units','normalized', 'Position',[.1,.05,.5,.72]);
ax = axes('Parent',fig, 'Position',[.1,.1,.75,.75]);
% Draw group block (绘制分组方块)
SCB_L = SClusterBlock(ax, rowGroup, 'Orientation','left', 'ColorList',rowColor, 'Group',rowGroup, 'GroupSep',2.5);
SCB_L.draw(); SCB_L.setXYTLim('XLim',[1.65,1.95], 'YLim',[0, 1], 'TLim',[-3*pi/2, pi/3]);
% Draw circular heatmap (绘制环形热图)
SHM = SHeatmap(ax, Data, 'Format','sq', 'RowGroup',rowGroup, 'GroupSep',2.5);
SHM.TickLength = .3;
SHM.draw();
SHM.setRowName(rowName)
SHM.setColName(colName)
SHM.setRowLabelLocation('right')
SHM.setColLabelLocation('top')
% YLim(1) -> TLim(1), YLim(2) -> TLim(2)
SHM.setXYTLim('XLim',[2, 3], 'YLim',[0, 1], 'TLim',[-3*pi/2, pi/3]);
SHM.Colorbar.Position(1) = SHM.Colorbar.Position(1) + .1;
gHdl = text(ax, SCB_L.X, SCB_L.Y, rgnames, 'FontSize',14, 'FontName','Times New Roman');
setTextPerpRadial(gHdl)
colormap(slanCM(97, 32))
More than 50 examples are incorporated into this tool: