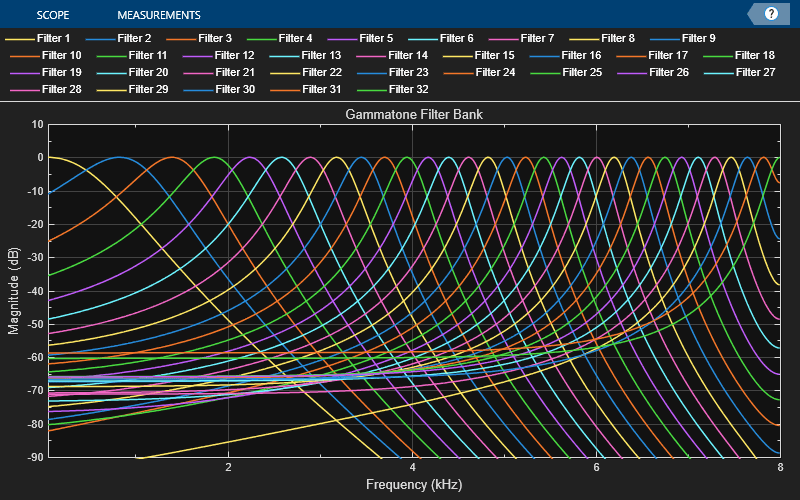
visualize
Description
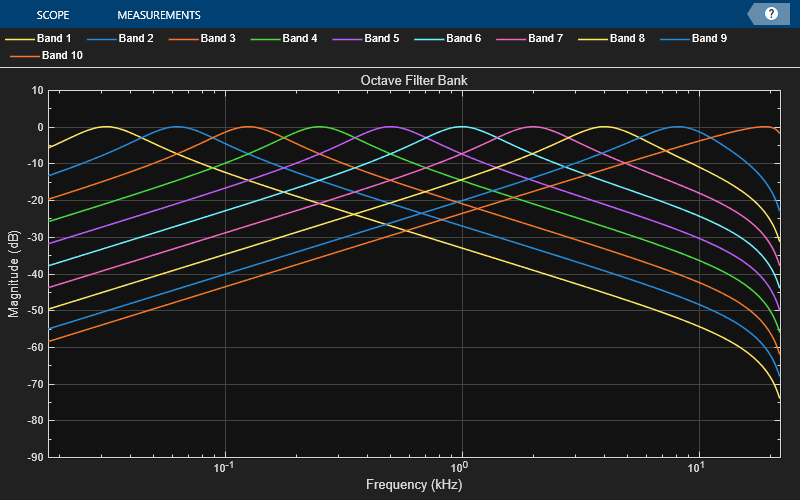
visualize( displays the magnitude
response of the filter bank. You can update the plot by changing the properties of the
filterBank)filterBank object.
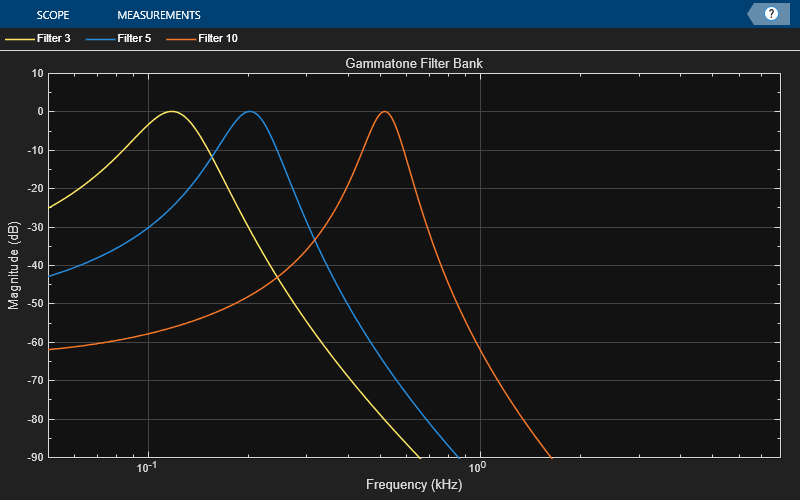
visualize(
visualizes the selected filters from the filter bank. filterBank,ind)
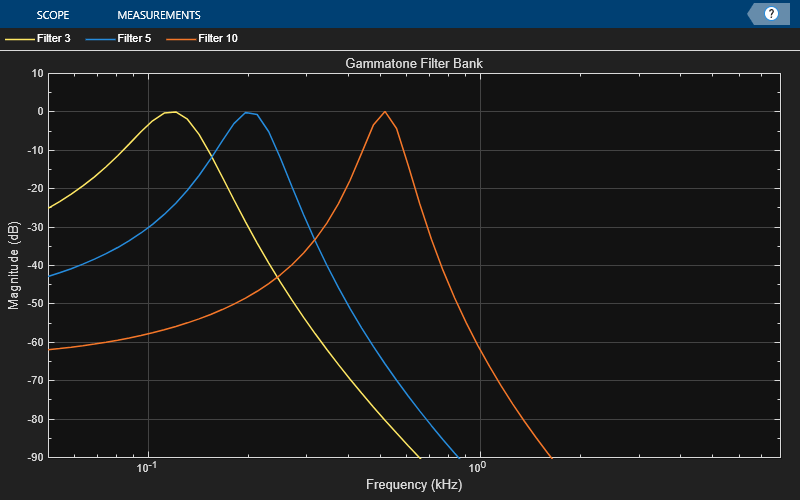
visualize(___,N= uses
n)n points to display the magnitude response. The default is 8096
points.
Examples
Input Arguments
Output Arguments
Version History
Introduced in R2024b
