Signal Reception Using Software-Defined Radios
This example shows how to tune software-defined radios (SDRs) to receive signals using the SDR Receiver app. In this example, you:
Configure SDRs for continuous signal reception.
Visualize the IQ samples, power spectrum, and constellation.
Correct RF impairments.
Export app configuration to MATLAB™ script.
Required Hardware and Software
To run this example, you need one of these radios and the corresponding software support package.
USRP™ N2xx series or B2xx series radio and Communications Toolbox Support Package for USRP Radio. For more information, see USRP Radio and Supported Hardware and Required Software.
USRP™ N3xx series, X series, or E320 radio and Wireless Testbench Support Package for NI USRP Radios. For more information, see Supported Radio Devices (Wireless Testbench) (Wireless Testbench).
ADALM-PLUTO radio and Communications Toolbox Support Package for Analog Devices® ADALM-PLUTO Radio. For more information, see ADALM-Pluto Radio.
RTL-SDR radio and Communications Toolbox™ Support Package for RTL-SDR Radio. For more information, see RTL-SDR Radio.
Introduction
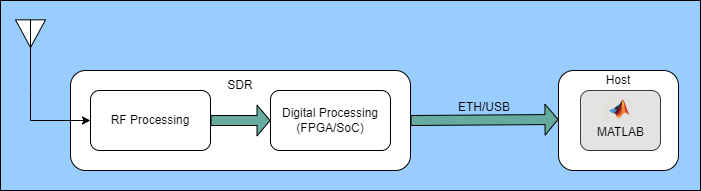
An SDR is a wireless device that consists of a configurable RF front end with an FPGA or programmable system-on-chip (SoC) to perform digital functions. Commercially available SDRs transmit and receive signals at different frequencies to implement wireless standards such as FM, LTE, WLAN, and 5G.
While using SDRs, the common challenges include setting the correct gain and estimating accurate frequency and phase offset values. The SDR Receiver app provides an interactive interface to tune the gain of the selected SDR. Additionally, the app also allows you to adjust the phase offset, fine frequency offset, and coarse frequency offset during signal reception and you can observe how each adjustment affects the received signal.
The image below shows the workflow used in the SDR Receiver app.
Open SDR Receiver App
To open the SDR Receiver app, run the command shown below.
app = SDRReceiver();
Configure Signal Parameters
Center Frequency (Hz): Specify Center Frequency as a nonnegative scalar. The valid range of Center Frequency value depends on the selected SDR.
The table below shows the Center Frequency range for USRP™ radios. For USRP radios with supported RF daughterboards, the valid range of Center Frequency depends on the RF daughterboard.
Radio | Center Frequency Range |
|---|---|
B Series | [34e6, 6e9] |
USRP N300, USRP N310 | [10e6, 6.05e9] |
USRP N320, USRP N321 | [3e6, 6.1e9] |
USRP X410 | [1e6, 8e9] |
USRP X300, USRP X310 | [10e6, 6e9] *This is typical range but varies with daughter board. |
N2xx-Series | [10e6, 6e9] *This is typical range but varies with daughter board. |
For more information on the range of center frequency, use info() method of the respective receiver System objects.
For PLUTO radio, the valid tuning range of Center Frequency is from 325 MHz to 3.8 GHz. Communications Toolbox Support Package for Analog Devices ADALM-Pluto Radio enables you to use the PLUTO radio outside the qualified tuning range by configuring the radio to operate using the AD9364 firmware. To extend the Center Frequency range, at the MATLAB command prompt, enter
configurePlutoRadio('AD9364').For RTL-SDR radio, the Center Frequency range depends on the tuner chips.
Tuner | Center Frequency Range |
|---|---|
Elonics E4000 | 52 - 2200 MHz with a gap from 1100 MHz to 1250 MHz (varies) |
Rafael Micro R820T | 24 - 1766 MHz |
Rafael Micro R828D | 24 - 1766 MHz |
Fitipower FC0013 | 22 - 1100 MHz (FC0013B/C, FC0013G has a separate L-band input, which is unconnected on most sticks) |
Fitipower FC0012 | 22 - 948.6 MHz |
FCI FC2580 | 146 - 308 MHz and 438 - 924 MHz (gap in between) |
For more information see [1].
Rx Gain (dB): Specify the SDR receiver gain in dB. The valid range of Rx Gain value depends on the selected SDR.
For USRP radios, the valid range of Rx Gain depends on the RF daughterboard. To get valid gain values, use the
info()method ofcomm.SDRuReceiver.For PLUTO radio, Rx Gain ranges varies with center frequency.
Center Frequency Range | Gain (in dB) |
|---|---|
70 MHz - 1300 MHz | [-1,73] |
1300 MHz - 4 GHz | [-3,71] |
4 GHz - 6 GHz | [-10,62] |
For RTL-SDR, the valid range of Rx Gain values depends on the tuner chip. To get valid gain values, use the
info()method ofcomm.SDRRTLReceiver.
Sample Rate (Hz): Specify the baseband sample rate of the radio front end in Hz as a positive numeric scalar.
For USRP radios, Sample Rate depends on the master clock rate (MCR) and decimation factor.
Hz
Radio | Master Clock Rate (MCR) | Supported Decimation Factor Value in the Range [1, 1024] |
|---|---|---|
B Series | Scalar in the range from | - [1, 3] - Odd integer from 4 to 128 - Even integer in the range - Integer multiple of 4 in the range |
N2xx-Series |
| - 2, when you set the - Odd integer from 4 to 128 - Even integer in the range - Integer multiple of 4 in the range
|
USRP N300 USRP N310 | - 122.88 MHz - 125.00 MHz - 153.60 MHz | - [1, 3] - Even integer in the range - Integer multiple of 4 in the range - Integer multiple of 8 in the range [512,1016] |
USRP N320 USRP N321 | - 200.00 MHz - 245.76 MHz - 250.00 MHz | - [1, 3] - Even integer in the range - Integer multiple of 4 in the range - Integer multiple of 8 in the range [512,1016] |
USRP X410 | - 245.76 MHz - 250.00 MHz | - [1, 3] - Even integer in the range - Integer multiple of 4 in the range - Integer multiple of 8 in the range [512,1016] |
USRP X300 USRP X310 | - 184.32 MHz - 200.00 MHz | - Integer in the range from 1 to 128 - Even integer in the range from 128 to 256 - Multiple of 4 in the range from 256 to 512 - Multiple of 8 in the range from 512 to 1016
|
For more information, see comm.SDRuReceiver.
For PLUTO radio, Sample Rate is the same value as the
BasebandSampleRateproperty ofcomm.SDRRxPluto. It ranges from 65105 to 61.44e6 samples per second.For RTL-SDR, the valid range of Sample Rate is (225, 300] kHz and (900, 3200] kHz. If you set the Sample Rate greater than 2560 kHz, you might observe dropped samples. For more information about the maximum reliable sample rate, see [1].
Frame Size: Specify number of samples per frame of the output signal as a positive integer.
For USRP radios, Frame Size must be an even positive integer from 1 to 256e6.
For PLUTO radio, Frame Size must be an even positive integer from 2 to 16,777,216.
For RTL-SDR radio, Frame Size must be an even positive integer from 1 to 375,000.
For more information on the range of parameters, use info() method of the respective receiver System objects.
Receive Signal
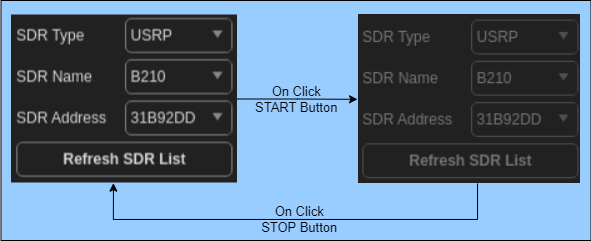
To receive the signal, click START and to pause the signal reception, click PAUSE. Once the signal reception starts, the app disables the Select SDR.
The app shows the status of reception as Receiving..... .
Apply RF Corrections
To ensure accurate signal transmission and reception in RF communication systems, you must perform RF corrections such as frequency and phase offset corrections.
Phase offset refers to the difference in phase between a received signal and a reference signal, which affects the signal integrity. Frequency offset refers to the difference between the expected carrier frequency and actual received frequency, which leads to signal misalignment and signal degradation.
The SDR Receiver app helps you to interactively estimate phase and frequency offsets using Phase Offset (deg), Coarse Frequency (Hz), and Fine Frequency (Hz) during simulation. Change these parameters to see how they impact the Constellation plot.
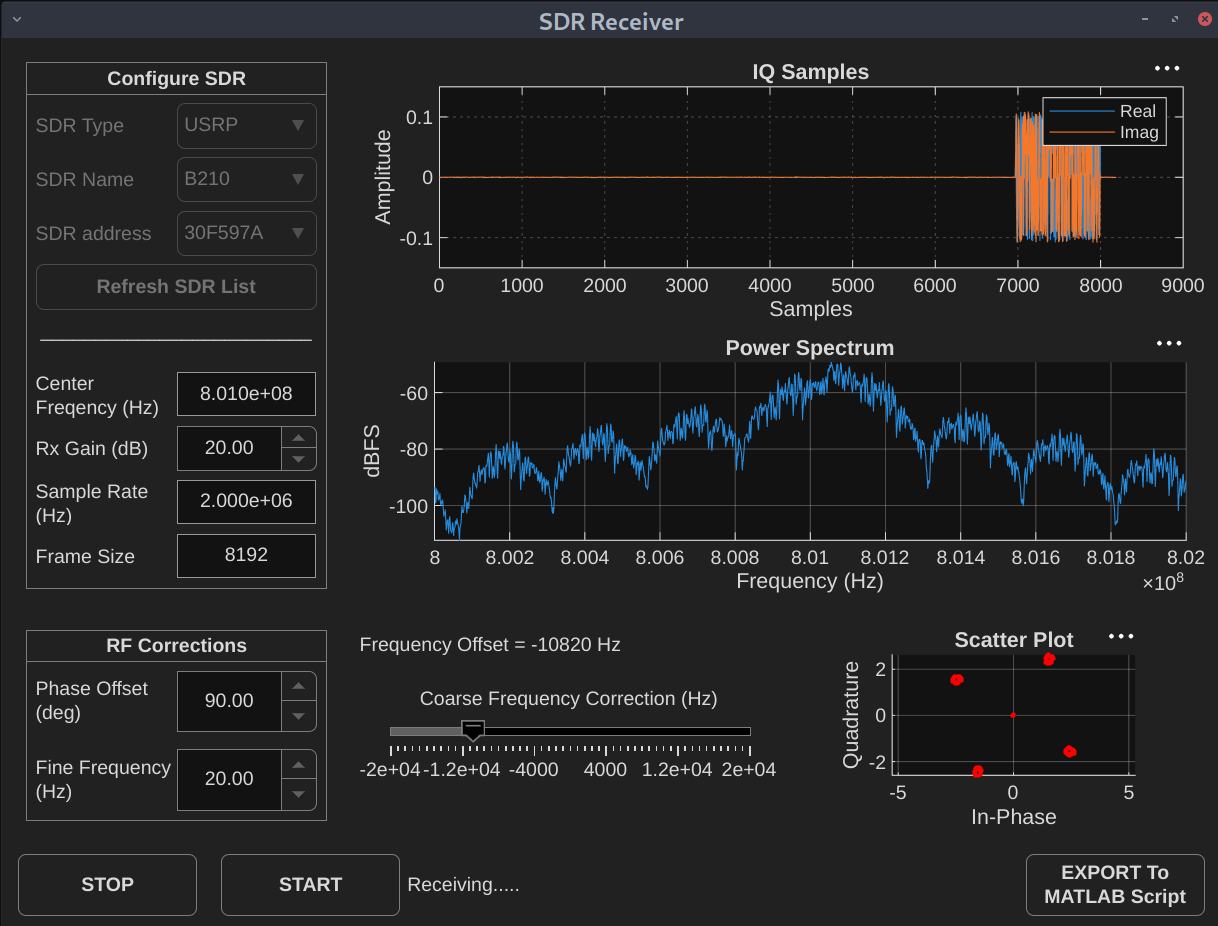
Visualize Received Signal
You can visualize the receiving signal using these three plots:
IQ Plot: Plots the real and imaginary parts of the receiving signal, where, X-axis is Samples and Y-axis is Amplitude.
Power Spectrum Plot: Plots the power spectrum of the received signal. The app generates these plots using the spectrumAnalyzer object. In the plot, the X-axis is Frequency in Hz and Y-axis is dBFS (decibels relative to full scale).
Constellation Plot: Plots the constellation of the received signal and estimates the phase and frequency offsets.
Stop Reception
To stop the signal reception, click STOP. Once the reception stops, the app enables the Select SDR controls, which allows you to change the radio.
Export to MATLAB Script
To generate MATLAB script for the current SDR Receiver app configuration, click Export To MATLAB Script button.
Close the App
To close the SDR Receiver app, run the command shown below.
app.delete();
Conclusion and Further Exploration
In this example, you tune your SDR and estimate phase and frequency offsets based on your requirements.
For more SDR examples, see:
References
[1] SDR (Software Defined Radio)
Helper Functions
SDRReceiver.mhelperUISDRRxWidgets.mhelperUISDRRxController.m