Amplitude Modulation Examples
These examples demonstrate amplitude modulation (AM) techniques.
QAM Constellation Shape Dependency on Modulation Orders
Plot various M-QAM constellations to demonstrate the shape depends on the modulation order.
Define a vector of vlaues for modulation order, , from the number of bits/symbol, .
k = 1:7;  % Number of bits per symbol
M = 2.^k; % Modulation order
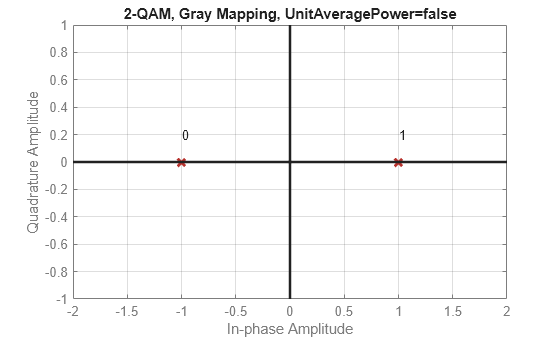
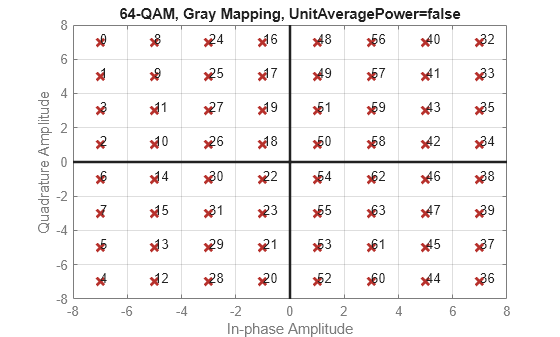
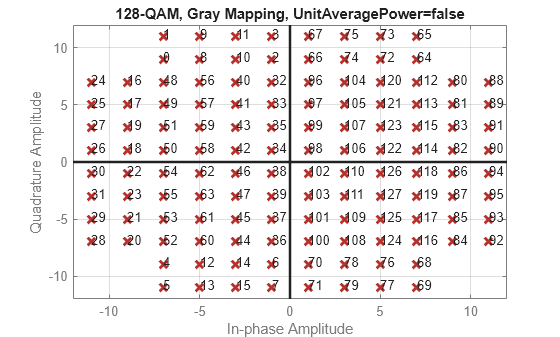
Use a for loop to create a data sequence that includes a complete set of symbols for the modulation scheme, modulate the data, and plot the constellation for each modulation order in the range of values in vector k. Note the constellation shape depends on the number of bits per symbol, .
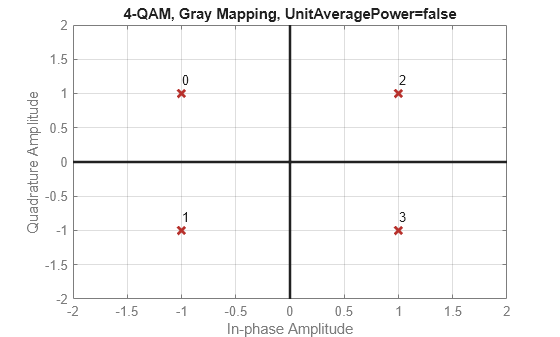
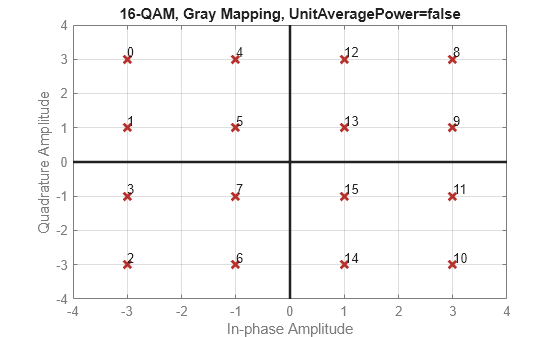
For even values of , the constellation is a square.
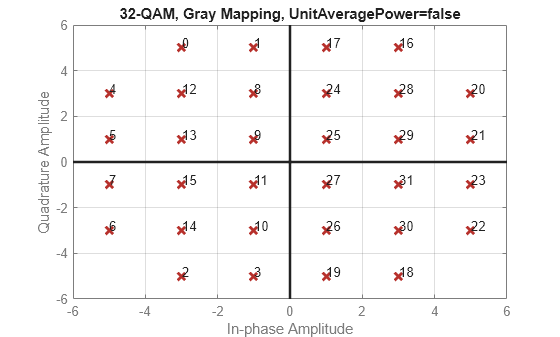
For odd values of , the constellation is a cross.
For and , the constellation is a rectangle.
for ii = 1:length(M)
    disp(['k = ',num2str(k(ii))])
    d = 0:M(ii)-1;
    y = qammod(d,M(ii),PlotConstellation=true);

end
k = 1
k = 2
k = 3

k = 4
k = 5
k = 6
k = 7
Compute Symbol Error Rate
In this example, you generate a random digital signal, modulate it, add noise, demodulate the noisy signal, and compute the symbol error rate. Then you plot the noisy, modulated data in a constellation diagram. The numerical results and plot may vary due to the random input data.
Create a random digital message and a constellation diagram System object™.
M = 16; % Alphabet size, 16-QAM
x = randi([0 M-1],5000,1);

cdpts = qammod(0:M-1,M);
constDiag = comm.ConstellationDiagram( ...
    ReferenceConstellation=cdpts, ...
    AxesLimits=[-4 4]);
Apply 16-QAM modulation and transmit the signal through an AWGN channel.
y = qammod(x,M);
ynoisy = awgn(y,15,'measured');
Demodulate the noisy data, ynoisy, to recover the message and check the symbol error rate.
z = qamdemod(ynoisy,M);
[num,errrate] = symerr(x,z)
num =
73
errrate =
0.0146
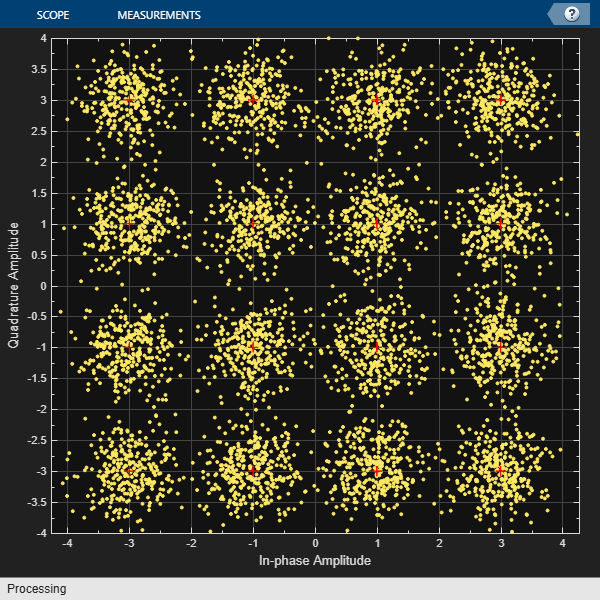
Plot the noisy data in a constellation diagram. The signal reference constellation has 16 precisely located points, but the noise added to the transmitted signal causes the scatter plot to have a small cluster of points scattered around each reference constellation point.
constDiag(ynoisy)
See Also
Functions
modnorm|rcosdesign|genqammod|genqamdemod|pammod|pamdemod|qammod|qamdemod
Objects
comm.RaisedCosineTransmitFilter|comm.RaisedCosineReceiveFilter|comm.GeneralQAMModulator|comm.GeneralQAMDemodulator
Blocks
- Raised Cosine Transmit Filter | Raised Cosine Receive Filter | General QAM Modulator Baseband | General QAM Demodulator Baseband | M-PAM Modulator Baseband | M-PAM Demodulator Baseband | Rectangular QAM Modulator Baseband | Rectangular QAM Demodulator Baseband