rSquaredMetric
Description
Use an RSquaredMetric object to track the
R2 (also known as the coefficient of
determination) when you train or test a deep neural network.
To specify which metrics to use during training, specify the Metrics option of the trainingOptions function. You can
use this option only when you train a network using the trainnet
function.
To plot the metrics during training, in the training options, specify Plots as "training-progress". If you specify the
ValidationData training option, then the software also plots and records the
metric values for the validation data. To output the metric values to the Command Window
during training, in the training options, set Verbose to true.
You can also access the metrics after training using the
TrainingHistory and ValidationHistory fields from
the second output of the trainnet function.
To specify which metrics to use when you test a neural network, use the metrics
argument of the testnet
function.
Creation
Description
metric = rSquaredMetricRSquaredMetric object. You can then specify metric as
the Metrics name-value argument in the trainingOptions
function or the metrics
argument of the testnet
function. With no additional options specified, this syntax is equivalent to specifying
the metric as "rSquared".
metric = rSquaredMetric(PropertyName=Value)Name and NetworkOutput properties using name-value arguments.
Properties
Object Functions
trainingOptions | Options for training deep learning neural network |
trainnet | Train deep learning neural network |
testnet | Test deep learning neural network |
Examples
Plot and record the training and validation R-squared when you train a deep neural network.
Load the training and test data from the DigitsDataTrain and DigitsDataTest MAT files, respectively. To access this data, open the example as a live script. The data set contains synthetic images of handwritten digits and the corresponding angles (in degrees) by which each image is rotated. The anglesTrain and anglesTest variables are the rotation angles in degrees.
load DigitsDataTrain.mat
load DigitsDataTest.mat
You can train a deep learning network to predict the rotation angle of the digit.
Create an image regression network.
layers = [
    imageInputLayer([28 28 1])
    convolution2dLayer(3,8,Padding="same")
    batchNormalizationLayer
    reluLayer
    averagePooling2dLayer(2,Stride=2)
    convolution2dLayer(3,16,Padding="same")
    batchNormalizationLayer
    reluLayer
    averagePooling2dLayer(2,Stride=2)
    convolution2dLayer(3,32,Padding="same")
    batchNormalizationLayer
    reluLayer
    convolution2dLayer(3,32,Padding="same")
    batchNormalizationLayer
    reluLayer
    dropoutLayer(0.2)
    fullyConnectedLayer(1)];
Create an RSquaredMetric object. You can use this object to record and plot the training and validation R-squared value.
metric = rSquaredMetric
metric =
  RSquaredMetric with properties:

             Name: "RSquared"
    NetworkOutput: []
         Maximize: 1
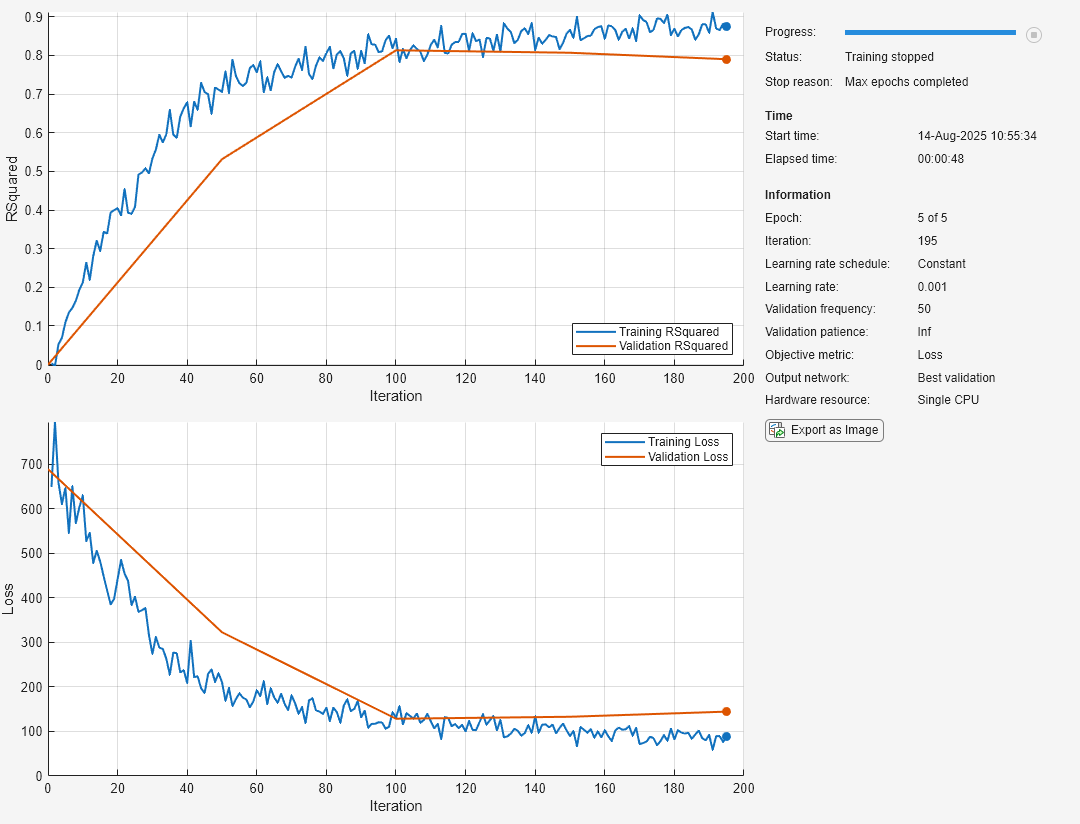
Specify the R-squared metric in the training options. To plot the R-squared during training, set Plots to "training-progress". To output the values during training, set Verbose to true.
options = trainingOptions("adam", ...
    MaxEpochs=5, ...
    Metrics=metric, ...
    ValidationData={XTest,anglesTest}, ...
    ValidationFrequency=50, ...
    Plots="training-progress", ...
    Verbose=true);
Train the network using the trainnet function.
[net,info] = trainnet(XTrain,anglesTrain,layers,"mse",options); Iteration Epoch TimeElapsed LearnRate TrainingLoss ValidationLoss TrainingRSquared ValidationRSquared
_________ _____ ___________ _________ ____________ ______________ ________________ __________________
0 0 00:00:00 0.001 688.66 -0.00015879
1 1 00:00:00 0.001 648.74 0.003303
50 2 00:00:09 0.001 210.63 343.6 0.70601 0.50099
100 3 00:00:15 0.001 130.91 127.46 0.84299 0.81489
150 4 00:00:21 0.001 90.105 105.53 0.86562 0.84674
195 5 00:00:27 0.001 87.829 91.218 0.87544 0.86752
Training stopped: Max epochs completed
Access the loss and R-squared values for the validation data.
info.ValidationHistory
ans=5×3 table
    Iteration     Loss      RSquared
    _________    ______    ___________

         0       688.66    -0.00015879
        50        343.6        0.50099
       100       127.46        0.81489
       150       105.53        0.84674
       195       91.218        0.86752
More About
Version History
Introduced in R2025a