Compare Surrogate Optimization with Other Solvers
This example compares surrogateopt to two other solvers: fmincon, the recommended solver for smooth problems, and patternsearch, the recommended solver for nonsmooth problems. The example uses a nonsmooth function on a two-dimensional region.
type nonSmoothFcnfunction [f, g] = nonSmoothFcn(x)
%NONSMOOTHFCN is a non-smooth objective function
% Copyright 2005 The MathWorks, Inc.
for i = 1:size(x,1)
if x(i,1) < -7
f(i) = (x(i,1))^2 + (x(i,2))^2 ;
elseif x(i,1) < -3
f(i) = -2*sin(x(i,1)) - (x(i,1)*x(i,2)^2)/10 + 15 ;
elseif x(i,1) < 0
f(i) = 0.5*x(i,1)^2 + 20 + abs(x(i,2))+ patho(x(i,:));
elseif x(i,1) >= 0
f(i) = .3*sqrt(x(i,1)) + 25 +abs(x(i,2)) + patho(x(i,:));
end
end
%Calculate gradient
g = NaN;
if x(i,1) < -7
g = 2*[x(i,1); x(i,2)];
elseif x(i,1) < -3
g = [-2*cos(x(i,1))-(x(i,2)^2)/10; -x(i,1)*x(i,2)/5];
elseif x(i,1) < 0
[fp,gp] = patho(x(i,:));
if x(i,2) > 0
g = [x(i,1)+gp(1); 1+gp(2)];
elseif x(i,2) < 0
g = [x(i,1)+gp(1); -1+gp(2)];
end
elseif x(i,1) >0
[fp,gp] = patho(x(i,:));
if x(i,2) > 0
g = [.15/sqrt(x(i,1))+gp(1); 1+ gp(2)];
elseif x(i,2) < 0
g = [.15/sqrt(x(i,1))+gp(1); -1+ gp(2)];
end
end
function [f,g] = patho(x)
Max = 500;
f = zeros(size(x,1),1);
g = zeros(size(x));
for k = 1:Max %k
arg = sin(pi*k^2*x)/(pi*k^2);
f = f + sum(arg,2);
g = g + cos(pi*k^2*x);
end
mplier = 0.1; % Scale the control variable
Objfcn = @(x)nonSmoothFcn(mplier*x); % Handle to the objective function
range = [-6 6;-6 6]/mplier; % Range used to plot the objective function
rng default % Reset the global random number generator
showNonSmoothFcn(Objfcn,range);
title('Nonsmooth Objective Function')
view(-151,44)

drawnow
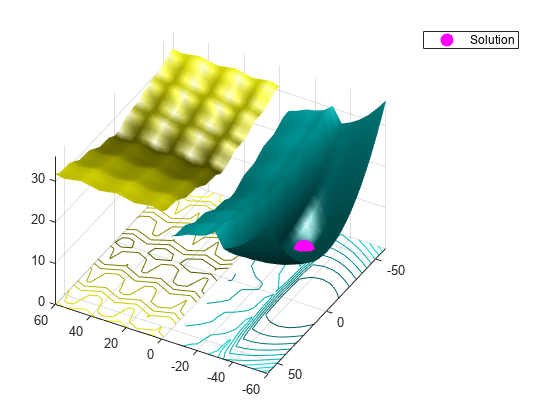
See how well surrogateopt does in locating the global minimum within the default number of iterations.
lb = -6*ones(1,2)/mplier;
ub = -lb;
[xs,fvals,eflags,outputs] = surrogateopt(Objfcn,lb,ub);

surrogateopt stopped because it exceeded the function evaluation limit set by
'options.MaxFunctionEvaluations'.
fprintf("Lowest found value = %g.\r",fvals)Lowest found value = 13.
figure
showNonSmoothFcn(Objfcn,range);
view(-151,44)
hold on
p1 = plot3(xs(1),xs(2),fvals,'om','MarkerSize',15,'MarkerFaceColor','m');
legend(p1,{'Solution'})
hold off

Compare with patternsearch
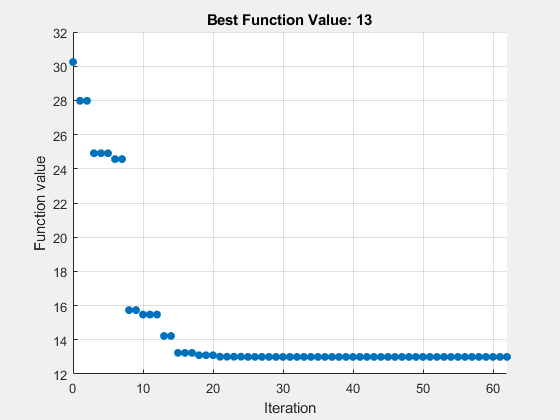
Set patternsearch options to use the same number of function evaluations, starting from a random point within the bounds.
rng default
x0 = lb + rand(size(lb)).*(ub - lb);
optsps = optimoptions('patternsearch','MaxFunctionEvaluations',200,'PlotFcn','psplotbestf');
[xps,fvalps,eflagps,outputps] = patternsearch(Objfcn,x0,[],[],[],[],lb,ub,[],optsps);
patternsearch stopped because the mesh size was less than options.MeshTolerance.

figure
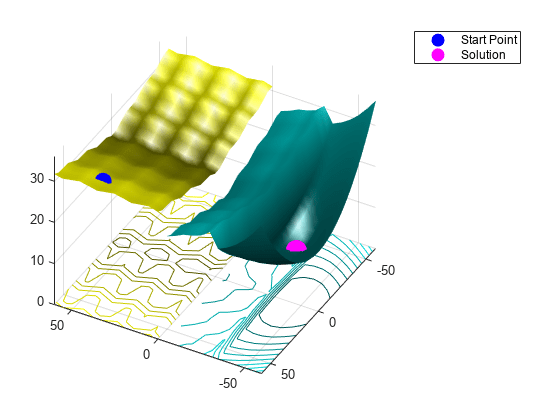
showNonSmoothFcn(Objfcn,range);
view(-151,44)
hold on
p1 = plot3(x0(1),x0(2),Objfcn(x0),'ob','MarkerSize',12,'MarkerFaceColor','b');
p2 = plot3(xps(1),xps(2),fvalps,'om','MarkerSize',15,'MarkerFaceColor','m');
legend([p1,p2],{'Start Point','Solution'})
hold off

patternsearch found the same solution as surrogateopt.
Restrict the number of function evaluations and try again.
optsurr = optimoptions('surrogateopt','MaxFunctionEvaluations',40);
[xs,fvals,eflags,outputs] = surrogateopt(Objfcn,lb,ub,optsurr);

surrogateopt stopped because it exceeded the function evaluation limit set by
'options.MaxFunctionEvaluations'.
optsps.MaxFunctionEvaluations = 40;
[xps,fvalps,eflagps,outputps] = patternsearch(Objfcn,x0,[],[],[],[],lb,ub,[],optsps);
patternsearch stopped because it exceeded options.MaxFunctionEvaluations.

Again, both solvers found the global solution quickly.
Compare with fmincon
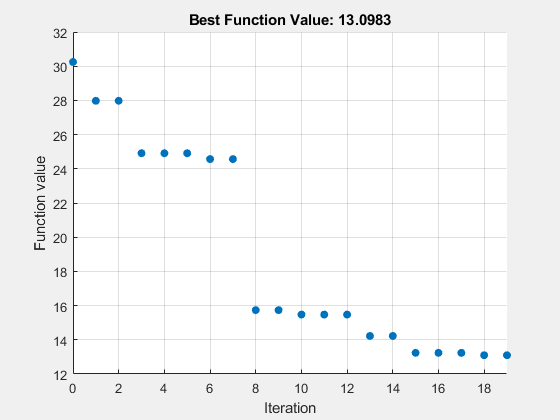
fmincon is efficient at finding a local solution near the start point. However, it can easily get stuck far from the global solution in a nonconvex or nonsmooth problem.
Set fmincon options to use a plot function, the same number of function evaluations as the previous solvers, and the same start point as patternsearch.
opts = optimoptions('fmincon','PlotFcn','optimplotfval','MaxFunctionEvaluations',200);
[fmsol,fmfval,eflag,fmoutput] = fmincon(Objfcn,x0,[],[],[],[],lb,ub,[],opts);

Local minimum possible. Constraints satisfied.

fmincon stopped because the size of the current step is less than
the value of the step size tolerance and constraints are
satisfied to within the value of the constraint tolerance.

<stopping criteria details>
figure
showNonSmoothFcn(Objfcn,range);
view(-151,44)
hold on
p1 = plot3(x0(1),x0(2),Objfcn(x0),'ob','MarkerSize',12,'MarkerFaceColor','b');
p2 = plot3(fmsol(1),fmsol(2),fmfval,'om','MarkerSize',15,'MarkerFaceColor','m');
legend([p1,p2],{'Start Point','Solution'})
hold off

fmincon is stuck in a local minimum near the start point.
See Also
fmincon | patternsearch | surrogateopt