Convert Vector Data to Raster Format
You can convert latitude-longitude vector data to a grid at any resolution you choose
to make a raster base map or grid layer. Certain Mapping Toolbox™ GUI tools help you do some of this, but you can also perform
vector-to-raster conversions from the command line. The principal function for gridding
vector data is vec2mtx, which allocates lines to a grid
of any size you indicate, marking the lines with 1s and the unoccupied grid cells with
0s. The grid contains doubles, but if you want a logical grid, cast the result to be a
logical array. To see an example, view Creating Data Grids from Vector Data.
If the vector data consists of polygons (patches), the gridded outlines are all
hollow. You can differentiate them using the encodem function, calling it with an array of rows, columns, and seed
values to produce a new grid containing polygonal areas filled with the seed values to
replace the binary values generated by vec2mtx.
Creating Data Grids from Vector Data
This example shows how to convert vector data to raster data using the vec2mtx function. The example uses patch data for Indiana from the usastatehi shapefile. For more information, see Convert Vector Data to Raster Format.
Use shaperead to get the patch data for the boundary.
indiana = shaperead('usastatehi.shp',...
    'UseGeoCoords', true,...
    'Selector', {@(name)strcmpi('Indiana',name),'Name'});
inLat = indiana.Lat;
inLon = indiana.Lon;
Convert the vectors to a regular data grid using vec2mtx. Set the grid density to be 40 cells per degree. Rasterize the boundary and generate a geographic raster reference object for it.
gridDensity = 40;
[inGrid,R] = vec2mtx(inLat,inLon,gridDensity);
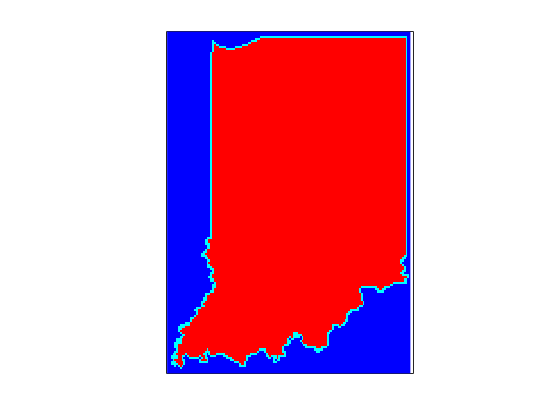
Make a map of the data grid in contrasting colors.
figure
axesm eqdcyl
meshm(inGrid,R)
colormap jet(4)
Set up the map limits.
setm(gca,'Flatlimit',R.LatitudeLimits,'FlonLimit',R.LongitudeLimits)
tightmap
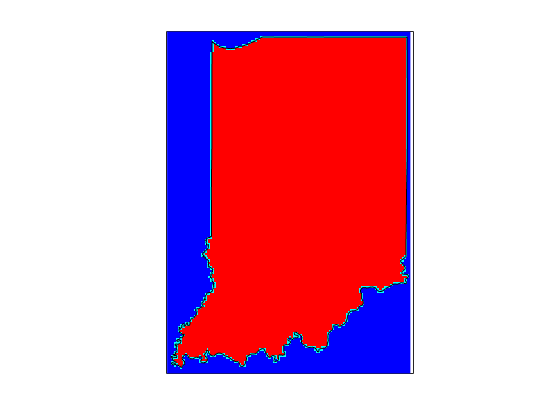
Specify the seed point and seed value. To fill (recode) the interior of Indiana, you need a seed point (which must be identified by row and column) and a seed value (to be allocated to all cells within the polygon). Select the middle row and column of the grid and choose an index value of 3 to identify the territory when calling encodem to generate a new grid. The last argument (1) identifies the code for boundary cells, where filling should halt.
inPt = round([size(inGrid)/2,3]);
inGrid3 = encodem(inGrid,inPt,1);
Clear and redraw the map using the filled grid.
meshm(inGrid3,R)
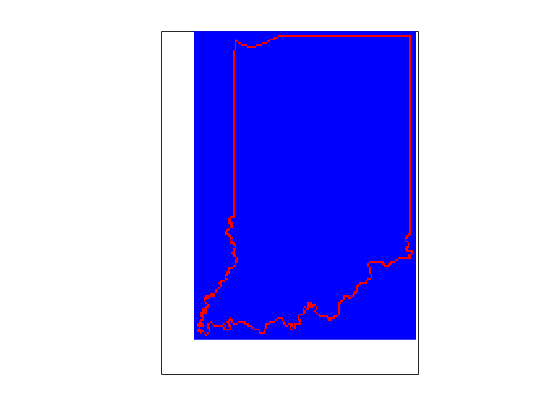
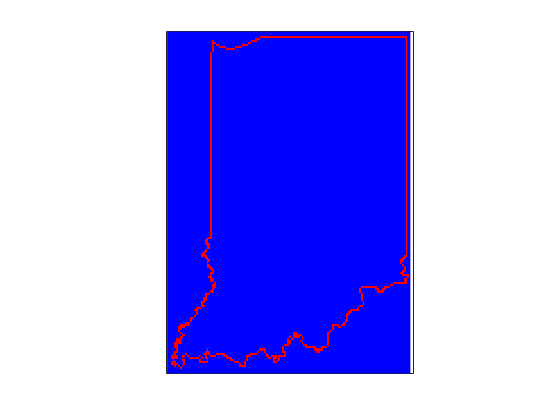
Plot the original vectors on the grid to see how well data was rasterized. You can use the Zoom tool on the figure window to examine the gridding results more closely.
plotm(inLat,inLon,'k')