Collect Code Coverage Metrics for MATLAB Source Code
R2026bWhen you run tests, you can collect and access code coverage
information for your MATLAB® source code by adding a plugin created from the matlab.unittest.plugins.CodeCoveragePlugin class to the test runner. With a
MATLAB
Test™ license, the plugin supports all structural coverage types, including
decision coverage, condition coverage, and modified condition/decision coverage (MC/DC), as
well as data type and size coverage. These coverage types help you analyze how thoroughly
tests exercise your source code. For more information about coverage types, see Types of Code Coverage for MATLAB Source Code.
This example shows how to collect coverage metrics programmatically by adding a plugin to the test runner. You can also collect coverage metrics interactively using various apps. For more information, see Interactively Collect Code Coverage.
Collect and Analyze Code Coverage Information
To run tests and perform a detailed code coverage analysis, use a test runner with a plugin that provides access to structural code coverage and data type and size coverage for your source code. By default, a CodeCoveragePlugin instance collects only the structural coverage metrics. To collect all coverage metrics, specify Metrics=["mcdc" "type-size"] when you create the plugin by using one of the static methods of the CodeCoveragePlugin class. (since R2026b)
For example, suppose you have a class named QuadraticPolynomial and an associated test class named QuadraticPolynomialTest that tests the source code in QuadraticPolynomial. Create a test runner with a plugin that collects information about all coverage types for the source code.
import matlab.unittest.plugins.CodeCoveragePlugin
import matlab.unittest.plugins.codecoverage.CoverageResult

runner = testrunner("textoutput");
format = CoverageResult;
plugin = CodeCoveragePlugin.forFile("QuadraticPolynomial.m", ...
    Producing=format,Metrics=["mcdc" "type-size"]);
addPlugin(runner,plugin)
Create a test suite from the test class and run the tests.
suite = testsuite("QuadraticPolynomialTest");
run(runner,suite);
Running QuadraticPolynomialTest .... Done QuadraticPolynomialTest __________
After the test run, the Result property of the CoverageResult object holds the coverage result. Access the coverage result and get a decision coverage summary. The returned vector includes the number of decision outcomes achieved by the tests and the total number of decision outcomes, respectively. In this example, the tests covered 2 out of 2 decision outcomes.
result = format.Result;
decisionSummary = coverageSummary(result,"decision")
decisionSummary = 1×2
2 2
Similarly, get a condition coverage summary. The returned vector includes the number of condition outcomes achieved by the tests and the total number of condition outcomes, respectively. In this example, the tests covered 4 out of 6 condition outcomes.
conditionSummary = coverageSummary(result,"condition")conditionSummary = 1×2
4 6
You can use the second output argument of the coverageSummary method to retrieve additional information, such as the number of times each condition was evaluated to true or false. For example, display how many times each condition was evaluated to false.
[~,conditionDescription] = coverageSummary(result,"condition")conditionDescription = struct with fields:
NumJustified: 0
condition: [1×3 struct]
disp([conditionDescription.condition.FalseCount])
0 1 0
The coverageSummary method does not support data type and size coverage. To view data type and size coverage information, you must generate a code coverage report.
Generate Interactive Code Coverage Report
Generate an interactive HTML code coverage report from the coverage result. The report displays the collected code coverage information and uses different colors to highlight the executed or missed outcomes.
generateHTMLReport(result)
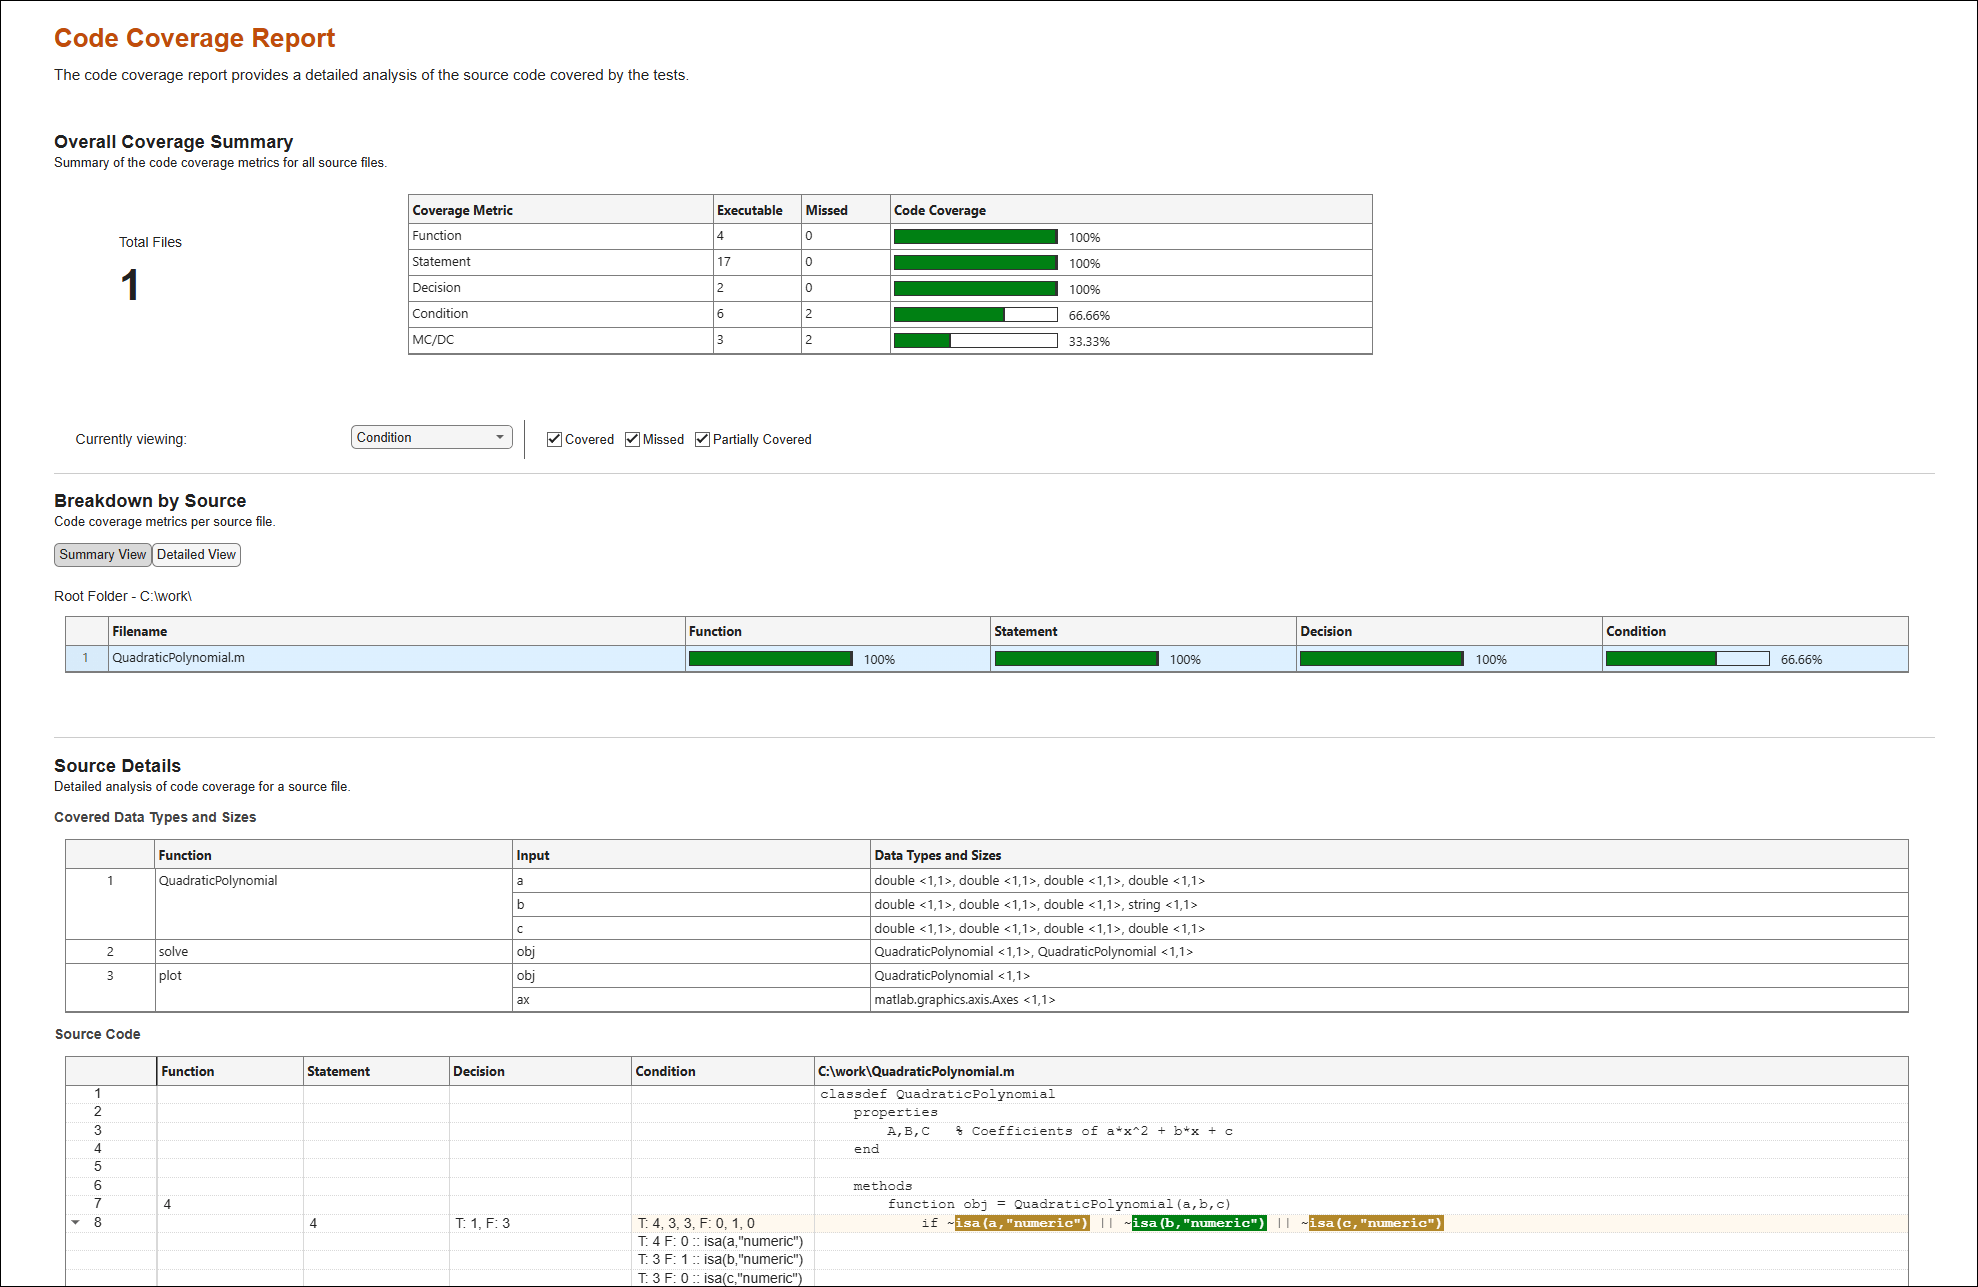
You can interact with the generated code coverage report. For example, in the Overall Coverage Summary section, you can select a structural coverage type from the Currently viewing list to view detailed information about that coverage type, and you can control the highlighting for covered, missed, or partially covered executables. The report has three sections:
Overall Coverage Summary — This section displays the structural code coverage metrics for the source code.
Breakdown by Source — This section displays the coverage metrics for each file in the source code. The value selected from the Currently viewing list determines which coverage metrics are displayed.
Source Details — This section provides the analysis details for a file selected in the Breakdown by Source section. The selections in the Overall Coverage Summary section determine the columns and code highlighting in the Source Code table. If you collect data type and size coverage, the information about the input data types and sizes appears in the Covered Data Types and Sizes table.
For example, the condition coverage view of the report indicates which conditions in a source file were evaluated to both true and false. You can refer to the Condition column of the Source Code table to learn how the tests evaluated each condition. For instance, T: 4, 3, 3 shows that the tests evaluated the three conditions to true four, three, and three times, respectively. On the other hand, F: 0, 1, 0 shows that the second condition was evaluated to false a single time, while the other two conditions were not evaluated to false. Out of six possible condition outcomes (that is, true and false for each of the three conditions), the tests achieved only four outcomes.
Now, access the MC/DC view of the report by selecting MC/DC from the Currently viewing list. MC/DC identifies how tests independently exercise conditions within decisions. A condition receives MC/DC if tests can:
Evaluate the condition to both
trueandfalse.Verify that the condition can independently affect the outcome of the decision it belongs to.
To examine these requirements, the testing framework finds the combinations of condition outcomes that tests must achieve for each condition. For example, this figure shows the Source Details section for the MC/DC view. In the Source Code table, if you expand the rows that have MC/DC information, the MC/DC column shows a pair of combinations for each condition, where T, F, and x denote true, false, and don't-care values, respectively. Achieving both combinations for a condition ensures that the condition evaluates to both true and false and that it independently affects the outcome of the decision:
For the first condition to receive MC/DC, tests must achieve the
TxxandFFFcombinations.For the second condition to receive MC/DC, tests must achieve the
FTxandFFFcombinations.For the third condition to receive MC/DC, tests must achieve the
FFTandFFFcombinations.
Out of the Txx, FFF, FTx, and FFT combinations, the tests achieved only the FFF and FTx combinations. Therefore, only the second condition satisfied the MC/DC requirements.
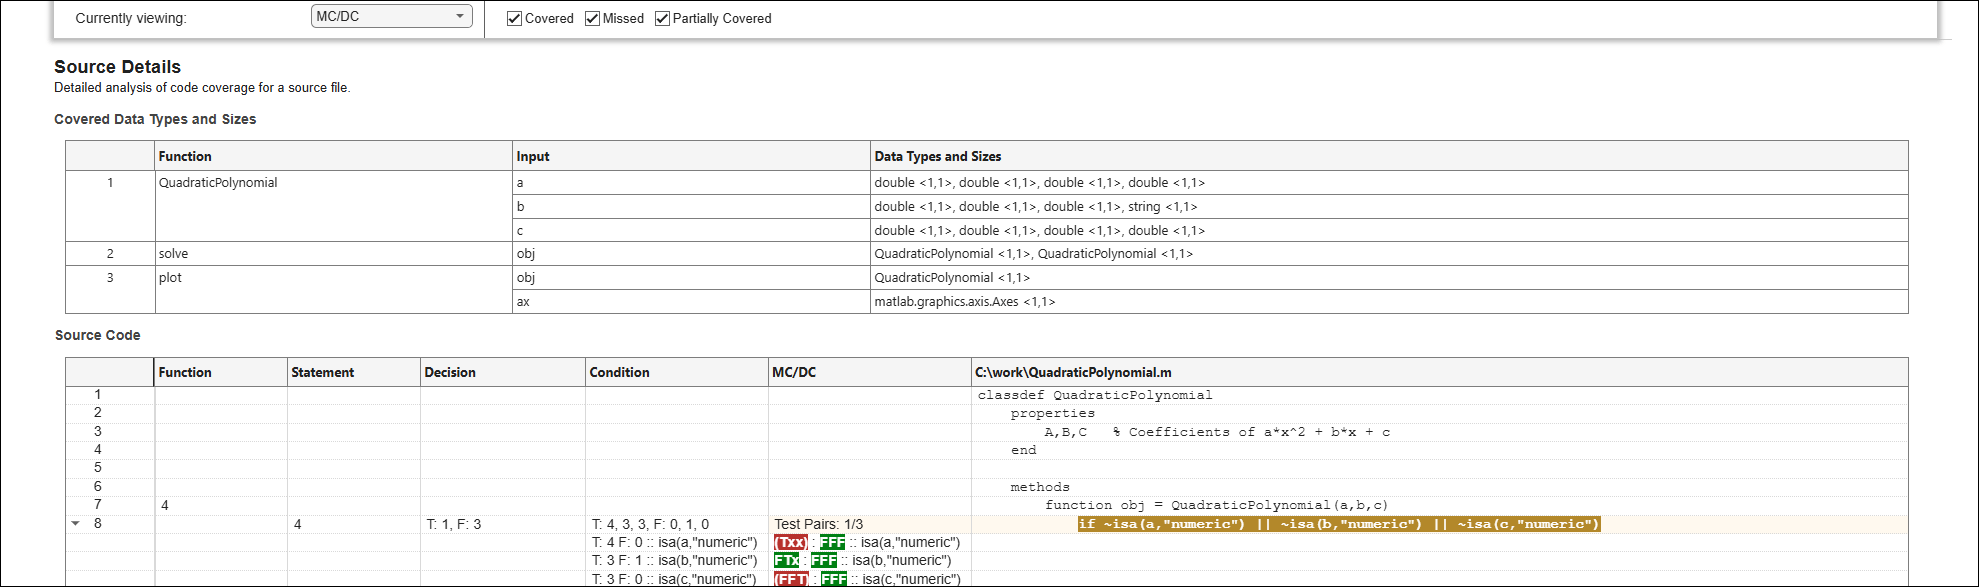
When you collect data type and size coverage, the report includes a Covered Data Types and Sizes table for the source file. The table lists the function inputs and the corresponding data types and sizes used in function calls during tests. You can inspect the table to determine the variety of input data types and sizes exercised by your tests. Data type and size coverage is supported for main functions in function files and public methods in class definition files.
Generate Standalone Code Coverage Report
Generate a standalone HTML code coverage report from the coverage result. Unlike an interactive code coverage report, a standalone report is a single file that contains hard-coded information.
generateStandaloneReport(result)
Generating standalone report. Please wait.
    Preparing content for the standalone report.
    Adding content to the standalone report.
    Writing standalone report to file.
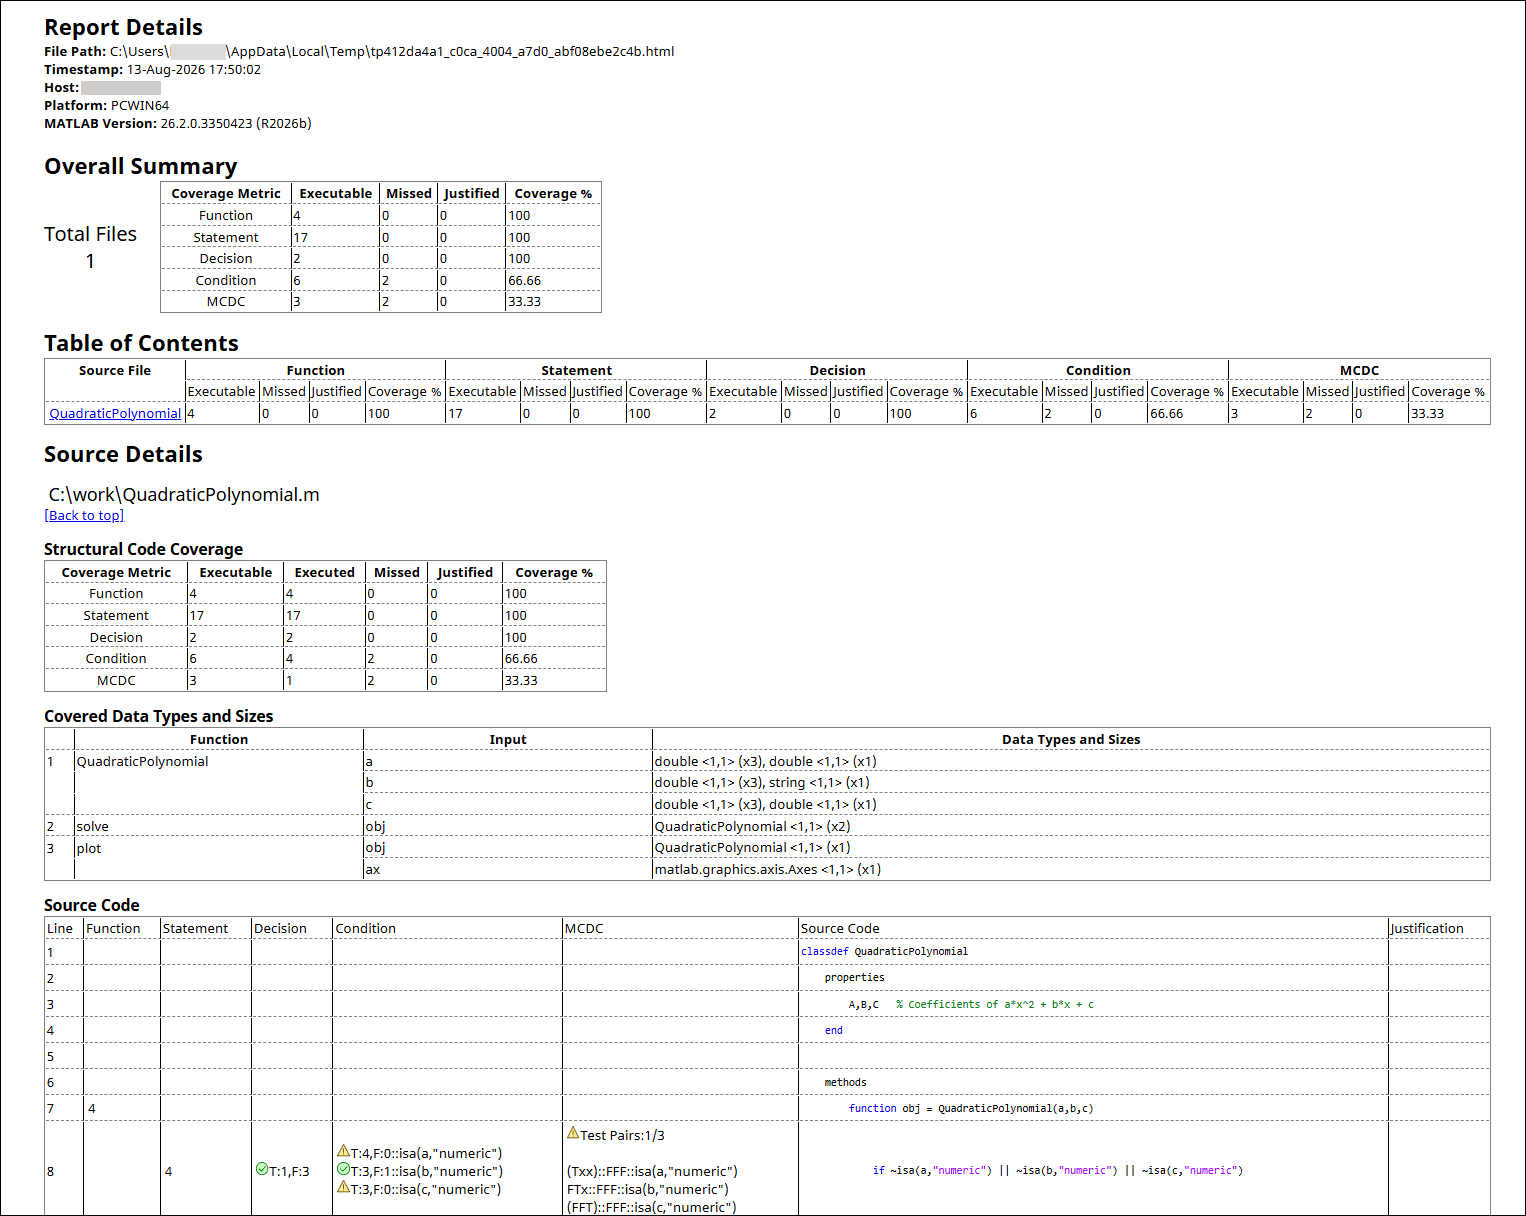
The report includes four sections:
Report Details — This section displays information about the report file, such as the platform and MATLAB version used to generate the file.
Overall Summary — This section displays the structural code coverage metrics for the source code.
Table of Contents — This section displays the coverage metrics for each file in the source code. You can use the hyperlinks in this section to navigate to the corresponding source file details that follow.
Source Details — This section provides detailed coverage information for each source file in the Table of Contents section.
The Source Details section provides the analysis details for each line of source code. Even though the report does not support code highlighting, it provides the same information as an interactive code coverage report. When you collect data type and size coverage, the Source Details section also includes a Covered Data Types and Sizes table for each applicable source file, which shows the data types and sizes of inputs used in function calls during tests.
See Also
Apps
Functions
Classes
matlab.unittest.plugins.CodeCoveragePlugin|matlab.coverage.Result|matlab.unittest.plugins.codecoverage.CoverageResult

