Display Multimodal Medical Image Data from PET and CT
This example shows how to display positron emission tomography (PET) and computed tomography (CT) scans together in 2-D and 3-D.
A medical imaging modality is the technique used to capture the image, such as X-ray, magnetic resonance imaging (MRI), or CT. Multimodal imaging refers to viewing multiple modalities together to obtain a more complete picture of the overall health of a patient. Often, multimodal imaging combines a structural modality, like CT or MRI, with a functional modality, like PET or single-photon emission computed tomography (SPECT). Structural modalities provide detailed 3-D visualizations of organs, bones, and blood vessels, while functional modalities generally have lower resolution, but can measure metabolic activity in tissues such as tumors.
When working with multimodal images, you must consider spatial differences between the images, such as different voxel spacing. Structural modalities often acquire images at a higher resolution than functional modalities, and certain display techniques, such as displaying images together as overlays, can require resampling. Additionally, unless you acquire images simultaneously on a combined scanner, you might need to perform image registration to align the images. In this example, you programmatically display a CT and PET scan acquired for one patient using a combined PET/CT with different voxel spacing.
To align and visualize multimodal images interactively, use the Medical Volume Viewer app. To get started, see Get Started with Medical Volume Viewer.
Download Data
This example uses a subset of data from one subject in a data set containing CT and PET images [1][2]. The size of the subset of data is approximately 137 MB. Run this code to download the data set from the MathWorks® website and unzip the folder.
zipFile = matlab.internal.examples.downloadSupportFile("medical", ...
    "CT-PET-Ventilation-Imaging/Chest-CT-PET.zip");
filepath = fileparts(zipFile);
unzip(zipFile,filepath)
Specify the path to the folder that contains the data after you run the above code to download the data. Each scan consists of a directory of DICOM files.
dataFolder = fullfile(filepath,"Chest-CT-PET");Import Data
Load the CT volume as a medicalVolume object. The medicalVolume object reads the directory of DICOM files and extracts the image data, spatial information, and modality from the file metadata.
medVolCT = medicalVolume(fullfile(dataFolder,"3.000000-CT Lung 3.0 B31f-00993"));Load the PET volume as a medicalVolume object.
medVolPET = medicalVolume(fullfile(dataFolder,"4.000000-Galligas Lung-14533"));Check the voxel spacing, in world units, for each volume. In this example, the VoxelSpacing property value is different between the CT and PET scans.
medVolCT.VoxelSpacing
ans = 1×3

    0.9766    0.9766    2.0000
medVolPET.VoxelSpacing
ans = 1×3

    2.0364    2.0364    2.2000
Visually Check Alignment
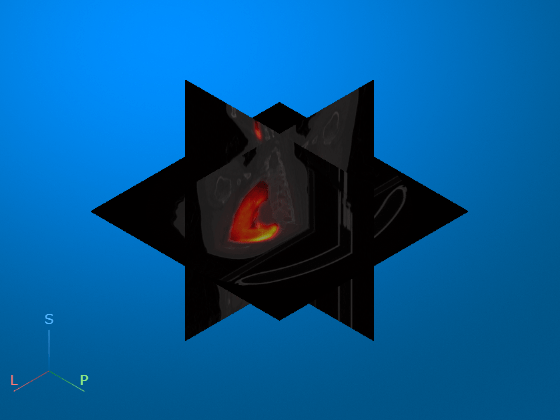
The data set used in this example has been acquired using a combined PET/CT scanner, so the images should already be aligned in the patient coordinate system. Visually confirm the alignment by displaying each medicalVolume object as a separate 3-D volume. The orange PET data is aligned with the lungs in the CT scan, as expected. If you try your own multimodal images and they are not aligned in patient coordinates, register them. For an example of multimodal image registration, see Register Multimodal Medical Image Volumes with Spatial Referencing.
viewer1 = viewer3d(CameraZoom=2,CameraPosition=[-1 -1355 -220]);

volshow(medVolPET,Parent=viewer1, ...
    RenderingStyle="GradientOpacity", ...
    Colormap=hot(256))

volshow(medVolCT,Parent=viewer1, ...
    RenderingStyle="SlicePlanes")
Resample PET Data
Resample the PET volume to match the spatial referencing of the CT volume.
petResampled = resample(medVolPET,medVolCT.VolumeGeometry);
Warning: An approximate world to intrinsic mapping is being used.
After resampling, verify that the PET data has the same voxel spacing as the CT scan.
medVolCT.VoxelSpacing
ans = 1×3

    0.9766    0.9766    2.0000
petResampled.VoxelSpacing
ans = 1×3

    0.9766    0.9766    2.0000
Display Multimodal Images
Display the CT data with the resampled PET data as an overlay.
To display the PET data as a continuous numerical heatmap, specify the
OverlayRenderingStyleas"VolumeOverlay".To display the full range of PET values, including background regions, specify the
OverlayThresholdas0.To display the PET data with a constant 50% transparency, specify the
OverlayAlphamapas0.5.
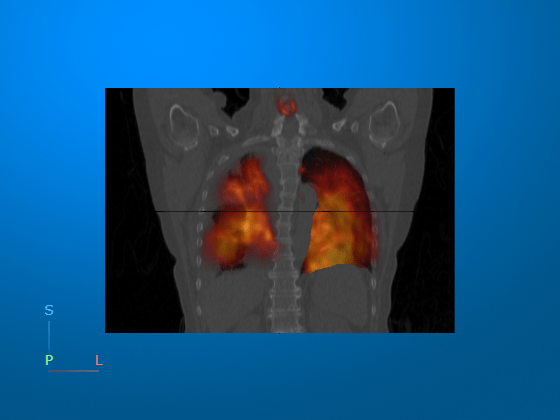
viewer2 = viewer3d;

Volume = volshow(medVolCT,Parent=viewer2, ...
    RenderingStyle="SlicePlanes", ...
    OverlayData=petResampled.Voxels, ...
    OverlayRenderingStyle="VolumeOverlay", ...
    OverlayDisplayRangeMode="data-range", ...
    OverlayThreshold=0, ...
    OverlayAlphamap=0.5, ...
    OverlayColormap=hot);
Change the camera position to focus on the coronal plane.
viewer2.CameraPosition = [-1 -1355 -220];
viewer2.CameraZoom = 1.5;
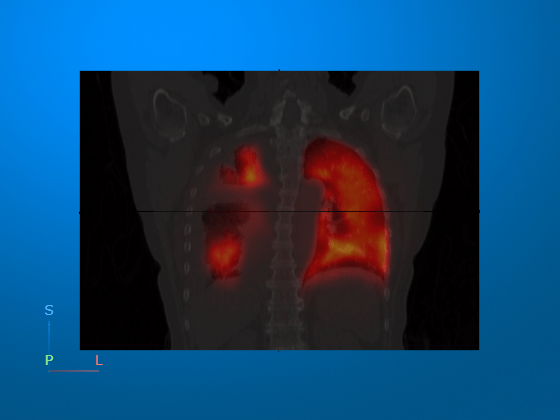
Optionally, you can change the colormap from hot to turbo.
viewer3 = viewer3d;

Volume = volshow(medVolCT,Parent=viewer3, ...
    RenderingStyle="SlicePlanes", ...
    OverlayData=petResampled.Voxels, ...
    OverlayRenderingStyle="VolumeOverlay", ...
    OverlayDisplayRangeMode="data-range", ...
    OverlayThreshold=0, ...
    OverlayAlphamap=0.5, ...
    OverlayColormap=turbo); % Change overlay colormap to turbo

viewer3.CameraPosition = [-1 -1355 -220];
viewer3.CameraZoom = 1.5;
You can interact with the displayed volume. To scroll through the coronal slices, pause on the coronal slice until it highlights red, then drag it along the anterior/posterior axis. To rotate the volume, click anywhere in the viewer and drag. This animation shows how to interact with the multimodal display.
References
[1] Eslick, Enid M., John Kipritidis, Denis Gradinscak, Mark J. Stevens, Dale L. Bailey, Benjamin Harris, Jeremy T. Booth, and Paul J. Keall. “CT Ventilation as a Functional Imaging Modality for Lung Cancer Radiotherapy (CT-vs-PET-Ventilation-Imaging).” The Cancer Imaging Archive, 2022. https://doi.org/10.7937/3PPX-7S22.
[2] Eslick, Enid M., John Kipritidis, Denis Gradinscak, Mark J. Stevens, Dale L. Bailey, Benjamin Harris, Jeremy T. Booth, and Paul J. Keall. “CT Ventilation Imaging Derived from Breath Hold CT Exhibits Good Regional Accuracy with Galligas PET.” Radiotherapy and Oncology 127, no. 2 (May 2018): 267–73. https://doi.org/10.1016/j.radonc.2017.12.010.
[3] Clark, Kenneth, Bruce Vendt, Kirk Smith, John Freymann, Justin Kirby, Paul Koppel, Stephen Moore, et al. “The Cancer Imaging Archive (TCIA): Maintaining and Operating a Public Information Repository.” Journal of Digital Imaging 26, no. 6 (December 2013): 1045–57. https://doi.org/10.1007/s10278-013-9622-7.