Stima spettrale
Analizza il contenuto spettrale di segnali campionati in modo uniforme o non uniforme utilizzando periodogram, pwelch o plomb. Migliora le stime del periodogramma utilizzando la riassegnazione. Determina la coerenza nel dominio della frequenza tra i segnali. Stima le funzioni di trasferimento in base alle misurazioni di input e output. Studia i sistemi MIMO nel dominio della frequenza.
App
| Signal Analyzer | Visualize and compare multiple signals and spectra |
Funzioni
Argomenti
- Nonparametric Methods
Learn about the periodogram, modified periodogram, Welch, and multitaper methods of nonparametric spectral estimation.
- Detect a Distorted Signal in Noise
Use frequency analysis to characterize a signal embedded in noise.
- Measure the Power of a Signal
Estimate the width of the frequency band that contains most of the power of a signal. For distorted signals, determine the power stored in the fundamental and the harmonics.
- Amplitude Estimation and Zero Padding
Obtain an accurate estimate of the amplitude of a sinusoidal signal using zero padding.
- Bias and Variability in the Periodogram
Reduce bias and variability in the periodogram using windows and averaging.
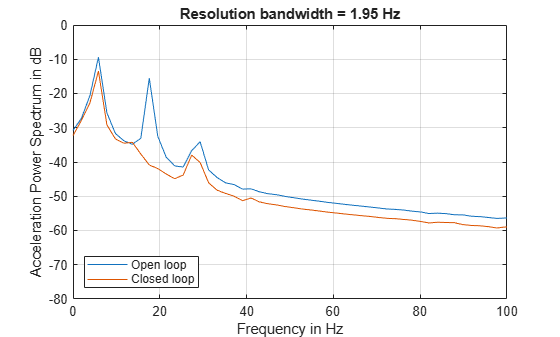
- Compare the Frequency Content of Two Signals
Identify similarity between signals in the frequency domain.
- Find Periodicity Using Frequency Analysis
Spectral analysis helps characterize oscillatory behavior in data and measure the different cycles.
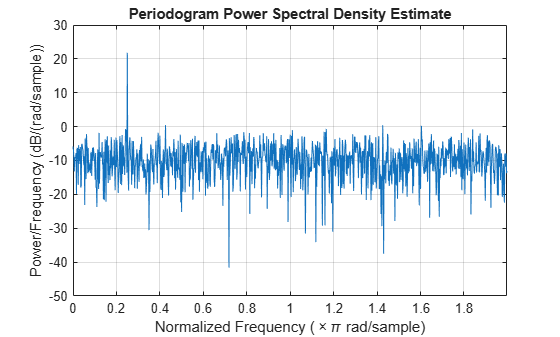
- Significance Testing for Periodic Component
Assess the significance of a sinusoidal component in white noise using Fisher's g-statistic.
- Cross Spectrum and Magnitude-Squared Coherence
Obtain the phase lag between sinusoidal components and identify frequency-domain correlation in a time series.
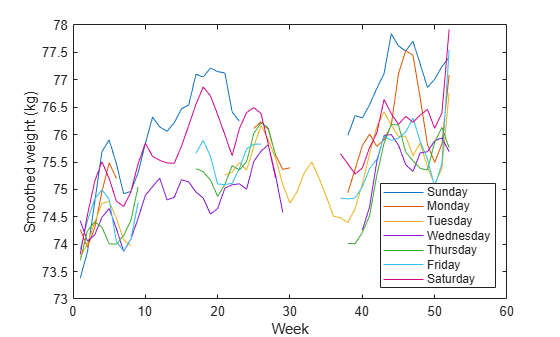
- Price Weather Derivatives (Financial Instruments Toolbox)
This example demonstrates a workflow for pricing weather derivatives based on historically observed temperature data.
Esempi in primo piano
Practical Introduction to Frequency-Domain Analysis
Perform and interpret basic frequency-domain signal analysis using simulated and real data.
Power Spectral Density Estimates Using FFT
Obtain nonparametric PSD estimates equivalent to the periodogram using the FFT directly.

Frequency-Domain Linear Regression
Construct a linear regression model for a time series using the discrete Fourier transform.
Detect Periodicity in a Signal with Missing Samples
Use the Lomb-Scargle periodogram to study the periodicity of an irregularly sampled signal.
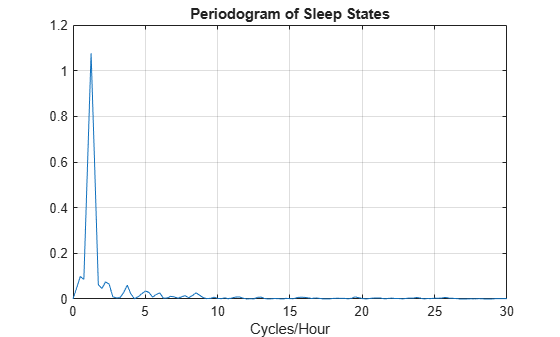
Find Periodicity in a Categorical Time Series
Perform spectral analysis of data whose values are not inherently numerical.