Debug C MEX S-Functions
About Debugging C MEX S-Functions
This section provides high-level tips on how to debug C MEX S-functions within the Simulink® environment and using third-party software. The following lists highlight some of the more common errors made when writing an S-function. For a more detailed analysis, use the debugger provided with your C compiler.
The examples at the end of this section show how to debug a C MEX S-function during simulation, using third-party software.
The first example uses the Microsoft® Visual Studio® 2022 environment.
The second example debugs an S-function on Linux® platform.
Refer to your compiler documentation for further information on debugging files.
Debug in Simulink Environment
Before you begin, make sure you have a good understanding of how to write C S-functions and the required callback methods. For assistance:
Read the section Available S-Function Implementations to determine if you implemented your S-function using the most appropriate method.
If your S-function is not compiling, first ensure that the mex
command is properly configured and your S-function includes all necessary files:
Run
mex -setupto ensure that your compiler is correctly installed.Confirm that you are passing all the source files needed by your S-function to the
mexcommand.Check that these additional source files are on the MATLAB® path.
Make sure that your S-function includes the
simstruc.hheader file. If you are accessing legacy code, make sure that any header files needed by that code are also included in your S-function.Make sure that your S-function does not include the
simstruc_types.horrtwtypes.hheader files. These Simulink and Simulink Coder™ header files are automatically included for you. If you are compiling your S-function as a MEX file for simulation, including thertwtypes.hfile results in errors.
If the mex command compiles your S-function, but your S-function does
not simulate or the simulation produces incorrect results, inspect your S-function source
code to ensure that:
You are not overwriting important memory
You are not using any uninitialized variables
The following table describes additional common S-function constructs that can lead to compilation and simulation errors.
| Does your S-function... | Look for... |
|---|---|
Use for loops to assign memory? | Instances where your S-function might inadvertently assign values outside of the array bounds. |
| Use global variables? | Locations in the code where the global variables can be corrupted. If you have multiple instances of your S-function in a model, they can write over the same memory location. |
| Allocate memory? | Memory your S-function does not deallocate. Always free memory that your
S-function allocates, using the malloc and
free commands to allocate and deallocate memory,
respectively. |
| Have direct feedthrough? | An incorrect direct feedthrough flag setting in your S-function. An
S-function can access its inputs in the set_param(model_name,'TryForcingSFcnDF','on') model_name have a direct feedthrough flag of
true for all their input ports. After you turn on this
property, if your simulation produces correct answers without causing an algebraic
loop, one of your S-functions in the model potentially set an incorrect direct
feedthrough flag. Consult the on direct feedthrough in sfuntmpl_doc.c for more information on diagnosing direct
feedthrough errors. |
| Access input signals correctly? | Instances in the code where your S-function uses incorrect macros to access input signals, for example when accessing a non-contiguous signal. Non-contiguous signals result when an S-function input port is fed by a Selector block that selects every other element of a vector signal. For non-contiguous input signals, use these commands. // In mdlInitializeSizes
ssSetInputPortRequiredContiguous(S, 0, 0);
// In mdlOutputs, access the inputs using
InputRealPtrsType uPtrs1 =
ssGetInputPortRealSignalPtrs(S,0); Note Starting in R2026a, S-Function blocks support only contiguous inputs. It is
recommended to use the contiguous input functions For contiguous input signals, use these commands. // In mdlInitializeSizes ssSetInputPortRequiredContiguous(S, 0, 1); // In mdlOutputs, access the inputs using const real_T *u0 = (const real_T*) ssGetInputPortSignal(S,0); /* If ssSetInputPortRequiredContiguous is 0, ssGetInputPortSignal returns an invalid pointer.*/ |
Debugging Techniques
You can use the following techniques for additional assistance with debugging your S-function.
Compile the S-function in debug mode using the
-goption for themexcommand. This enables additional diagnostics features that are called only when you compile your S-function in debug mode.
Place
ssPrintfssPrintfstatements to print return values to the MATLAB command prompt to check if your code is producing the expected results.Type
feature memstatsat the MATLAB command prompt to query the memory usage.Use the MATLAB File & folder Comparisons tool, or other text differencing application, to look for textual changes in different versions of your S-function. This can help you locate changes that disabled an S-function that previously compiled and ran. See Compare Files and Folders and Merge Files for instructions on how to use the File & folder Comparisons tool.
Use settings on the Configuration Parameters dialog box to check for memory problems.
Set the Solver data inconsistency diagnostic to
warning.Set the Array bounds exceeded diagnostic to
warningorerror(See Checking Array Bounds for more information on how to use this diagnostic).Turn the Signal storage reuse (Simulink Coder) optimization off.
Separate the S-function's algorithm from its Simulink interface then use the S-Function Builder block to generate a new Simulink interface for the algorithm. The S-Function Builder block ensures that the interface is implemented in the most consistent method.
Automatically Launch Third-Party Software from Simulink for Debugging C MEX S-Function
This section provides an example of how to launch an external debugger directly from Simulink to debug your C MEX S-function.
Before beginning the example, save the files sfcndemo_timestwo and timestwo.c into your
working folder.
Ensure that you have a compatible compiler installed in your system. Run
mex -setupin the MATLAB command line to select a compiler.Open the Simulink model
sfcndemo_timestwo.Create a version of the MEX file that you can debug by compiling the C file using the
mexcommand with the-goption.mex -g timestwo.c
The
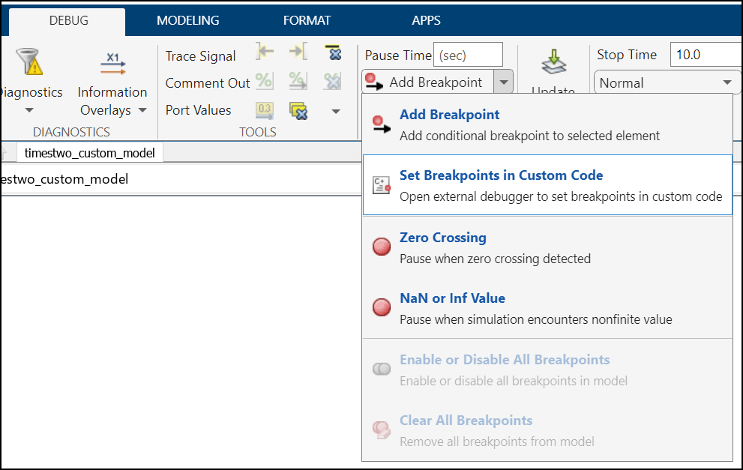
-goption creates the executabletimestwo.mexw64with debugging symbols included. At this point, you may want to simulate thesfcndemo_timestwomodel to ensure it runs properly.Go to the Debug tab in Simulink and select Set Breakpoints in Custom Code option. This opens the Select Entities to Debug dialog box that lists entities that can be debugged.
Select the S-function listed as
sfcndemo_timestwo/Input Times 2
              S-Function
under S-function Blocks and move it to Selected Entities.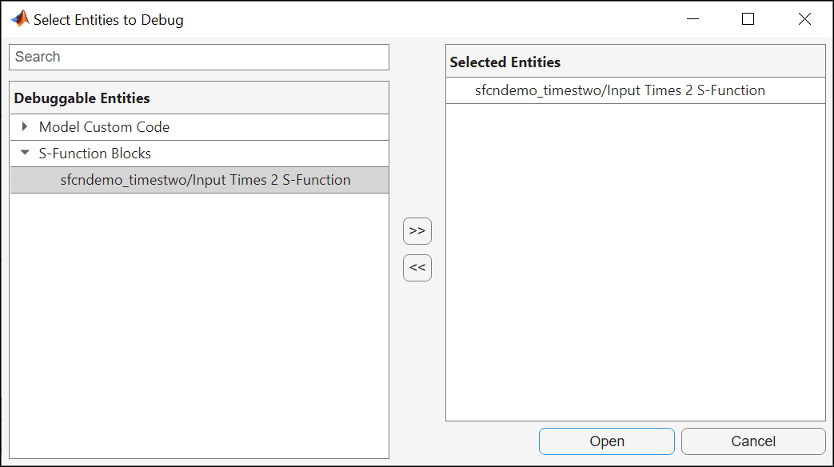
Click Open to launch the external debugger.
Set a breakpoint on the desired line of code by right-clicking on the line and selecting Breakpoint > Insert Breakpoint from the context menu. If you have not previously run the model, the breakpoint may show up with a question mark, indicating that the executable is not loaded. Subsequently running the model loads the mex file and removes the question mark from the breakpoint.
Start the simulation from the
sfcndemo_timestwoSimulink model. This should enable you to start debugging the S-function from your debugger.
Manually Configure Simulink and Third-Party Software for Debugging C MEX S-Function
You can debug and profile the algorithm portion of your S-function using third-party software if you separate the algorithm from the S-function's Simulink interface. You cannot debug and profile the S-function's interface with the Simulink engine because the Simulink interface code does not ship with the product.
You can additionally use third-party software to debug an S-function during simulation,
as shown in the following two examples. These examples use the Simulink model sfcndemo_timestwo and the C MEX S-function timestwo.c.
Debugging C MEX S-Functions Using the Microsoft Visual Studio 2022 Environment
Before beginning the example, save the files sfcndemo_timestwo and timestwo.c into your
working folder.
Open the Simulink model
sfcndemo_timestwo.Create a version of the MEX file that you can debug by compiling the C file using the
mexcommand with the-goption.mex -g timestwo.c
The
-goption creates the executabletimestwo.mexw64with debugging symbols included. At this point, you may want to simulate thesfcndemo_timestwomodel to ensure it runs properly.Without exiting the MATLAB environment, start Microsoft Visual Studio.
From the Microsoft Development Environment menu bar, select Debug > Attach to Process.
In the Attach to Process dialog box that opens, select the
MATLAB.exeprocess in the Available Processes list.For the Attach to: option, select Native from the list of code types and click OK. You should now be attached to the MATLAB process.
Clear the MEX functions in MATLAB using the
clearcommand.clear mex
From the Microsoft Development Environment File menu, select Open > File. Select the
timestwo.csource files from the file browser that opens.Set a breakpoint on the desired line of code by right-clicking on the line and selecting Breakpoint > Insert Breakpoint from the context menu. If you have not previously run the model, the breakpoint may show up with a question mark, indicating that the executable is not loaded. Subsequently running the model loads the
.mexw64file and removes the question mark from the breakpoint.Start the simulation from the
sfcndemo_timestwoSimulink model. This should enable you to start debugging the S-function from the Microsoft Development Environment.
Debugging C MEX S-Functions on Linux Platforms
Before beginning the example, save the files sfcndemo_timestwo and timestwo.c into your
working folder.
Create a version of the MEX file for debugging:
Open the Simulink model
sfcndemo_timestwo.Create a version of the MEX file that you can debug by compiling the C file using the
mexcommand with the-goption:mex -g timestwo.c
The
-goption creates the executabletimestwo.mexa64with debugging symbols included.Simulate the
sfcndemo_timestwomodel to ensure it runs properly.Exit the MATLAB environment.
Debug the MEX file:
Start the MATLAB environment in debugging mode using this command:
matlab -D<nameOfDebugger>The
-Dflag starts the MATLAB environment within the specified debugger. For example, to use thegdbdebugging tool on the Linux platform, enter this command.matlab -DgdbOnce the debugger has loaded, continue loading the MATLAB environment by typing
runat the debugger prompt(gdb).run -nodesktopStarting program: matlab ...
Note
The debugger might stop on spurious segmentation violation signals that result from interactions with the underlying Java® Virtual Machine (JVM®). You can ignore these messages and continue, using the
contcommand. If you are not debugging segmentation violation signals and want to suppress these messages, enter the commandhandle SIGSEGV nostop noprint pass.Open the
sfcndemo_timestwoSimulink model.Press Ctrl+C to open the debugger.
At the
(gdb)prompt, set breakpoints in the source code, for example:break timestwo.c:37Breakpoint 1 (timestwo.c:37) pending (gdb)
At the
(gdb)prompt, enter thecontcommand to continue.cont
Use your debugger routines to debug the S-function. For more information, see the
gdbdocumentation that is part of your operating system documentation.
See Also
Level-2 MATLAB S-Function | S-Function Builder | S-Function | MATLAB Function