Design Custom Gauges
You can design custom gauges that look like displays in a real system or animate a signal using the Circular Gauge, Horizontal Gauge, and Vertical Gauge blocks. This example gives step-by-step guidance to design a thermometer using the Vertical Gauge block and an ammeter using the Circular Gauge block.
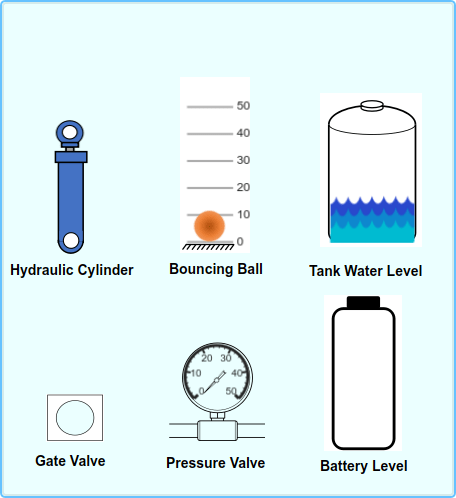
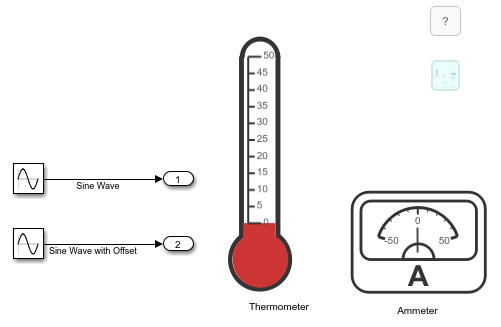
The model for this example includes several customized gauges connected to the output of a Sine Wave block. The example gives step-by-step instructions to design the gauge blocks in the canvas of the model. The model includes a panel that contains additional customized gauges you can explore on your own. The example directory includes a folder with all the SVG images used to create the gauges.
Design a Thermometer Using the Vertical Gauge Block
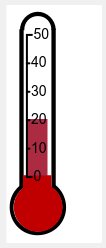
The thermometer designed using the Vertical Gauge block uses a background image to define the shape of the thermometer and the value bar of the Vertical Gauge block to indicate the value of the connected signal during simulation. The Battery Level block in the panel uses a similar design strategy.
To design a thermometer, add a Vertical Gauge block to the model using the quick insert menu:
To open the quick insert menu, double-click in the canvas.
To search for the customizable Vertical Gauge block, type
Vertical Gauge.Select the search result with the library path
Simulink/Dashboard/Customizable Blocks.
To modify the design of the Vertical Gauge block, enter design mode:
In the model canvas, select the Vertical Gauge block.
In the Simulink® Toolstrip, click the Gauge tab.
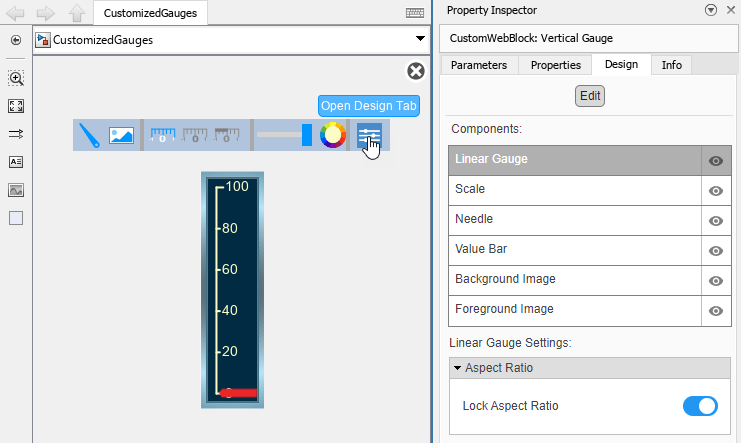
On the Gauge tab, click Edit. A toolbar appears above the Vertical Gauge block.
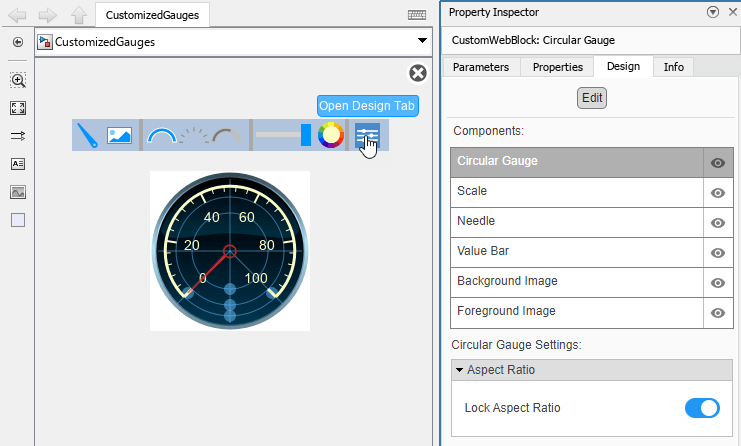
To open the Property Inspector, in the toolbar, click Open Design Tab. In design mode, the Design tab of the Property Inspector is active.
Add the thermometer background image:
Select the Background Image component in the Design tab.
In the Select Image section, click the plus button.
Navigate inside the
CustomGaugeImagesfolder and select theThermometer.svgfile.
The thermometer design uses the value bar, not the needle, to indicate the value of the connected signal. To remove the needle image, in the Design tab, select the Needle component. Then, in the Select Image section, click the X button.
Next, adjust the scale range, color, position, and size:
In the Design tab, select the Scale component.
In the Range section, change the Maximum to 50.
In the Ticks section and the Labels section, change Color to black so the tick marks are more visible on the white background.
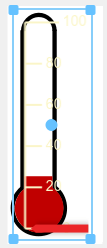
Resize the scale so it fits inside the white column of the thermometer background image. You can adjust the width and height of the scale interactively on the block or by using the Design tab. When resizing interactively, you can maintain the aspect ratio of the scale by pressing Shift as you drag the corners of the block. To use the Design tab, in the Size and Position section, adjust the Width and Height.
Align the zero point on the scale with the top of the red area of the background image.
Finally, change the value bar width and color:
In the Design tab, select the Value Bar component.
In the Value Preview section, adjust the slider to preview what the value bar shows when the input value is greater than the minimum scale value.
In the Value Bar section, change Color to red.
Widen the value bar so it fills the majority of the thermometer. You can use interactive controls on the block or use the Design tab. In the Design tab, under Value Bar, adjust Size.
Decrease the value bar opacity so the labels are easier to read.
When you finish adjusting the design for the thermometer, to exit design mode, in the Property Inspector, on the Design tab, click Edit.
You can use the finished thermometer to display a signal value. In the model, a Sine Wave block represents the temperature.
Connect the Vertical Gauge block to the Sine Wave with Offset signal:
Select the Vertical Gauge block.
Click the Connect button that appears above the block.
Select the
Sine Wave with Offsetsignal.Select the
Sine Wave with Offsetoption in the table that appears below the selected signal.Click the
Xin the upper right corner of the Simulink window.
To see the thermometer in action, simulate the model. This model uses simulation pacing to slow model execution so you can see the fluid move in the thermometer. For more information about simulation pacing, see Simulation Pacing Options.
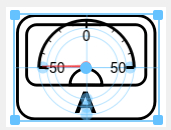
Design an Ammeter Using the Circular Gauge Block
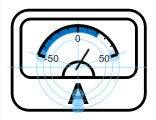
The ammeter designed using the Circular Gauge block uses a background image to define the appearance of the ammeter, and uses a needle image and a value bar to indicate the value of the connected signal during simulation. The Pressure Gauge block in the panel uses a similar design strategy.
To design an ammeter, add a Circular Gauge block to the model.
If the Property Inspector is not open to the Design tab with the Edit button pressed:
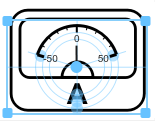
In the model canvas, select the Circular Gauge block.
In the Simulink Toolstrip, click the Gauge tab.
On the Gauge tab, click Edit. A toolbar appears above the Circular Gauge block.
To open the Property Inspector, in the toolbar, click Open Design Tab.
Add the ammeter background image:
Select the Background Image component in the Design tab.
In the Select Image section, click the plus button.
Select the
Ammeter.svgfile.
Change the scale limits and color:
In the Design tab, select the Scale component.
In the Range section, change the Minimum to
-50and the Maximum to50.In the Ticks section and the Labels section, change the Color to black so the tick marks are more visible on the white background.
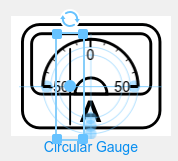
The ammeter scale starts and ends on the horizontal crosshairs. The scale Start Angle specifies the position for the scale minimum, and the scale Arc specifies the extent of the scale arc, both in degrees. In the Design tab, under Range, change the Start Angle and the Arc to 180.
Adjust the scale position so the entire scale fits within the display area of the ammeter background image, with the center of the needle positioned approximately at the center of the semicircle.
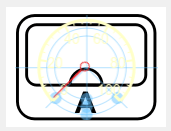
Replace the needle image:
In the Design tab, select the Needle component.
In the Select Image section, click the plus button.
Select the
Needle.svgfile.
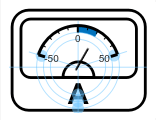
The needle image is a straight black line. The saved image is too large for the size of the block and oriented so that the needle does not point to the zero point on the scale. To rotate the needle image, click the needle rotation button in the block. Then, use the needle grab handles in the block to resize and reposition the needle so it starts at the center of the semicircle in the background image and ends before the label for the scale minimum.
Preview the value bar:
Open the Value Bar component.
To see how the value bar grows as the needle moves, move the slider in the Value Preview section.
The value bar grows from the origin. By default, the origin is the minimum of the scale.
Change the origin to zero:
Open the Scale component.
In the Range section, set Origin to
0.
To see the change, open the Value Bar component, and move the slider in the Value Preview section. The value bar grows from zero, the new origin.
When you finish adjusting the design for the ammeter, to exit design mode, in the Property Inspector, on the Design tab, click Edit.
You can use the finished ammeter to display a signal value. In the model, a Sine Wave block represents the input to the ammeter.
Connect the Circular Gauge block to the Sine Wave signal:
Select the Circular Gauge block.
Click the Connect button that appears above the block.
Select the Sine Wave block output signal.
Select the
Sine Waveoption in the table that appears below the selected signal.Click the
Xin the upper right corner of the Simulink window.
To see the ammeter in action, simulate the model. This model uses simulation pacing to slow model execution so you can see the needle move on the ammeter. For more information about simulation pacing, see Simulation Pacing Options.
Explore More Customized Gauges
The panel in the model contains more examples of customized gauges built using the Circular Gauge, Horizontal Gauge, and Vertical Gauge blocks. For more information on panels, see Getting Started with Dashboard Panels. To view the panel, double-click the panel icon in the model. You can drag the panel into the canvas or resize the window to view the panel. To see how the gauges respond to changing input values, simulate the model. The CustomGaugeImages folder includes the SVG images used to create each gauge so you can try replicating the designs on your own.