Capture Wideband Spectrum by Combining Data from Multiple Antennas
This example shows how to configure a software-defined radio (SDR) as a baseband receiver to capture a wideband spectrum by combining received data from multiple antennas using a multiband combiner. The example also plots the combined wideband spectrogram of the captured data.
Introduction
In this example, you use the baseband receiver object to capture a wide frequency band by combining data from two radio antennas with different center frequencies. Because each antenna captures data at a different center frequency, you can capture a wider frequency band than using a single antenna. To view the whole frequency band, you then use the comm.MultibandCombiner System object™.
Required Hardware
This example runs with the following NI™ USRP™ networked series and X series radios:
USRP N310
USRP N320
USRP N321
USRP X300
USRP X310
USRP X410
Set Up Radio
Call the radioConfigurations function. The function returns all available radio setup configurations that you saved using the Radio Setup wizard.
savedRadioConfigurations = radioConfigurations;
To update the dropdown menu with your saved radio setup configuration names, click Update. Then select the radio to use with this example.
savedRadioConfigurationNames = [string({savedRadioConfigurations.Name})];
radio = savedRadioConfigurationNames(1) ;
;Configure Baseband Receiver
Create a basebandReceiver object with the specified radio. Because the object requires exclusive access to radio hardware resources, before running this example for the first time, clear any other object associated with the specified radio. In subsequent runs, to speed up the execution time of the example, reuse your new workspace object.
if ~exist("bbrx","var")
    bbrx = basebandReceiver(radio);
end
To capture the largest combined bandwidth, set the SampleRate property to the maximum supported value on the SDR. Choose a single antenna bandwidth less than or equal to the maximum instantaneous bandwidth of your radio and less than the chosen sample rate to reduce aliasing effects.
To obtain the maximum sample rate and instantaneous bandwidth available for your radio, call the hMaxSampleRate and hMaxBandwidth helper functions. Alternatively, you can set custom values.
maxSampleRate = hMaxSampleRate(radio); bbrx.SampleRate =maxSampleRate; maxBandwidth = hMaxBandwidth(radio); singleAntennaBandwidth =
maxBandwidth;
Set the Antennas property to a value that corresponds to two antennas that support different center frequencies on the SDR.
To update the dropdown menu with antennas that support different center frequencies, call the hIndependentFrequencyCaptureAntennas helper function. Then select the antennas to use with this example.
[firstAntennaSelection, secondAntennaSelection] = hIndependentFrequencyCaptureAntennas(radio); bbrx.Antennas = [firstAntennaSelection(1),
secondAntennaSelection(1)];
Because the multiband combining operation (after capture) requires double-precision or single-precision input data, configure the baseband receiver to return the captured data in single precision.
bbrx.CaptureDataType = "single";Set the RadioGain property according to the local signal strength.
bbrx.RadioGain =  30;
30;Set the center frequency for each antenna by shifting the center frequency of the combined band by half of the single antenna bandwidth.
centerFrequency =2.55e9; bbrx.CenterFrequency = [centerFrequency - singleAntennaBandwidth/2, ... centerFrequency + singleAntennaBandwidth/2];
Capture IQ Data and Combine in a Loop
Use the background capture capability to capture IQ data in parallel with combining the data from a previous capture in a loop.
To capture IQ data from the specified antennas in the background, call the capture function on the basebandReceiver object, bbrx. Specify a capture length of 5 ms and set the Background name-value argument to true. Specify capture.mat as the location of the MAT file where the IQ data will be saved.
captureLength = milliseconds(5);
matFileLocation = "capture.mat";
capture(bbrx,captureLength,Background=true,SaveLocation=matFileLocation);
Create a comm.MultibandCombiner System object to combine the captured data from each antenna.
mbc = comm.MultibandCombiner( ...
    InputSampleRate=bbrx.SampleRate, ...
    FrequencyOffsets=(bbrx.CenterFrequency-centerFrequency), ...
    OutputSampleRateSource="Auto");
Set the stopTime variable to repeatedly capture and combine IQ data for 20 seconds. Alternatively, set the value to Inf to continually capture and plot the combined spectrum.
stopTime = 20;
Use the hStopCaptureButton helper function to create a figure with a button. Press the button to set the stopCapture variable to true and exit the loop before the stopTime.
stopCapture = false;
buttonFigure = hStopCaptureButton("stopCapture");
startTime = tic;
Create the capture loop which will stop when the time elapses or the Stop button is pressed.
while(toc(startTime) < stopTime && ~stopCapture)Use the isCapturing function to wait until the capture is finished. Include a 10 ms pause in the while loop to avoid excessive polling.
    while isCapturing(bbrx)
        pause(0.01);
    end
When the capture has completed, retrieve the location of the saved IQ data using the captureOutputs function. Load the data into the workspace and delete the MAT file.
    matFileLocation = captureOutputs(bbrx);
    load(matFileLocation,"data");
    delete(matFileLocation);
Start the next capture in the background while the IQ data from the previous capture is combined.
capture(bbrx,captureLength,Background=true,SaveLocation=matFileLocation);
Filter and Combine Captured Data
To reduce aliasing effects, filter the captured data to the selected bandwidth. Use the comm.MultibandCombiner System object and combine the captured data from each antenna. Reset the object after use.
    filteredData = lowpass(data,singleAntennaBandwidth/2,bbrx.SampleRate);
    combinedData = mbc(filteredData);
    mbcInfo = info(mbc);
    reset(mbc);
    resampledData = resample(combinedData,2*singleAntennaBandwidth,mbcInfo.OutputSampleRate);
Plot Spectrogram
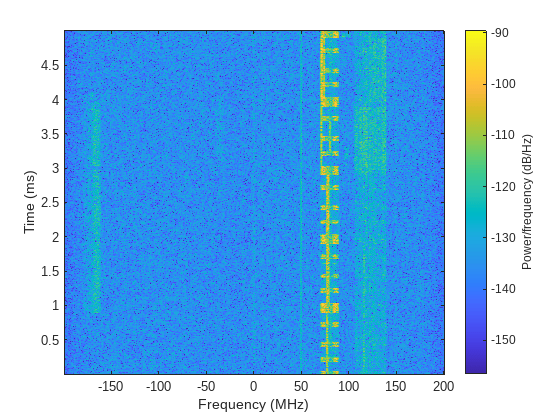
Plot the spectrogram of the resampled data. The example uses 4096 FFT points and a 50% overlapping Hann window of length equal to the length of the resampled data divided by 4096. Alternatively, you can experiment with custom values.
window =hann(floor(length(resampledData)/4096)); nOverlap =
floor(length(window)/2); nFFT =
4096; spectrogram(resampledData,window,nOverlap,nFFT,2*singleAntennaBandwidth,"centered");
To ensure updates to the figure are displayed, use the drawnow function.
    drawnow limitrate;
end
When the loop ends, close the button figure.
% If stopCapture is false, the button figure remains open
if ~stopCapture
    close(buttonFigure);
end