- /
-
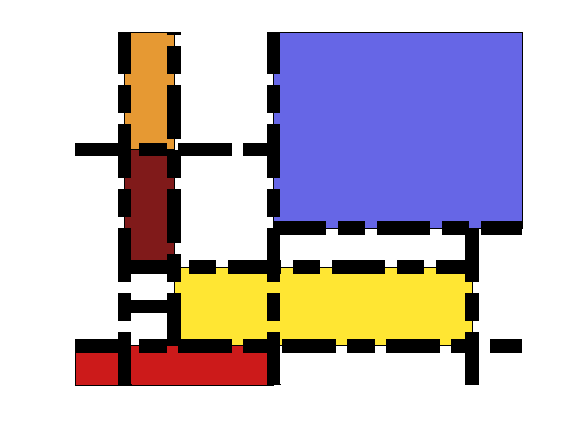
Mondrian Dash Line
on 1 Nov 2021
- 1
- 80
- 0
- 0
- 276
%Piet MATLAB
% figure('Color',[.7 .7 .7]) %Gary
%nO 2 , nO 3
a=[4 4 0 9
8 8 0 4
0 9 1 1
1 2 2 2
1 8 3 3
0 4 6 6
4 9 4 4
1 1 0 9
2 2 1 9];
%patch coords
b=[1 2 3 6
4 9 4 9
0 4 0 1
2 8 1 3
1 2 6 9];
%color palettes, R B R Y orange
f=reshape([.5 .1 .1
.4 .4 .9
.8 .1 .1
1 .9 .2
.9 .6 .2],5,1,3);
patch([b(:,[1 2 2 1])]',[b(:,[3 3 4 4])]',f)
hold
for k=1:9
plot(a(k,1:2),a(k,3:4),'k-.','LineWidth',10);
end
axis off