Risultati per
- clearly outlines all the possible inputs
- provides default values for each input
- will produce auto-complete suggestions while typing in the Editor (and Command Window in newer versions)
- checks each input against validation functions to enforce size, shape (e.g., column vs. row vector), type, and other options (e.g., being a member of a set)

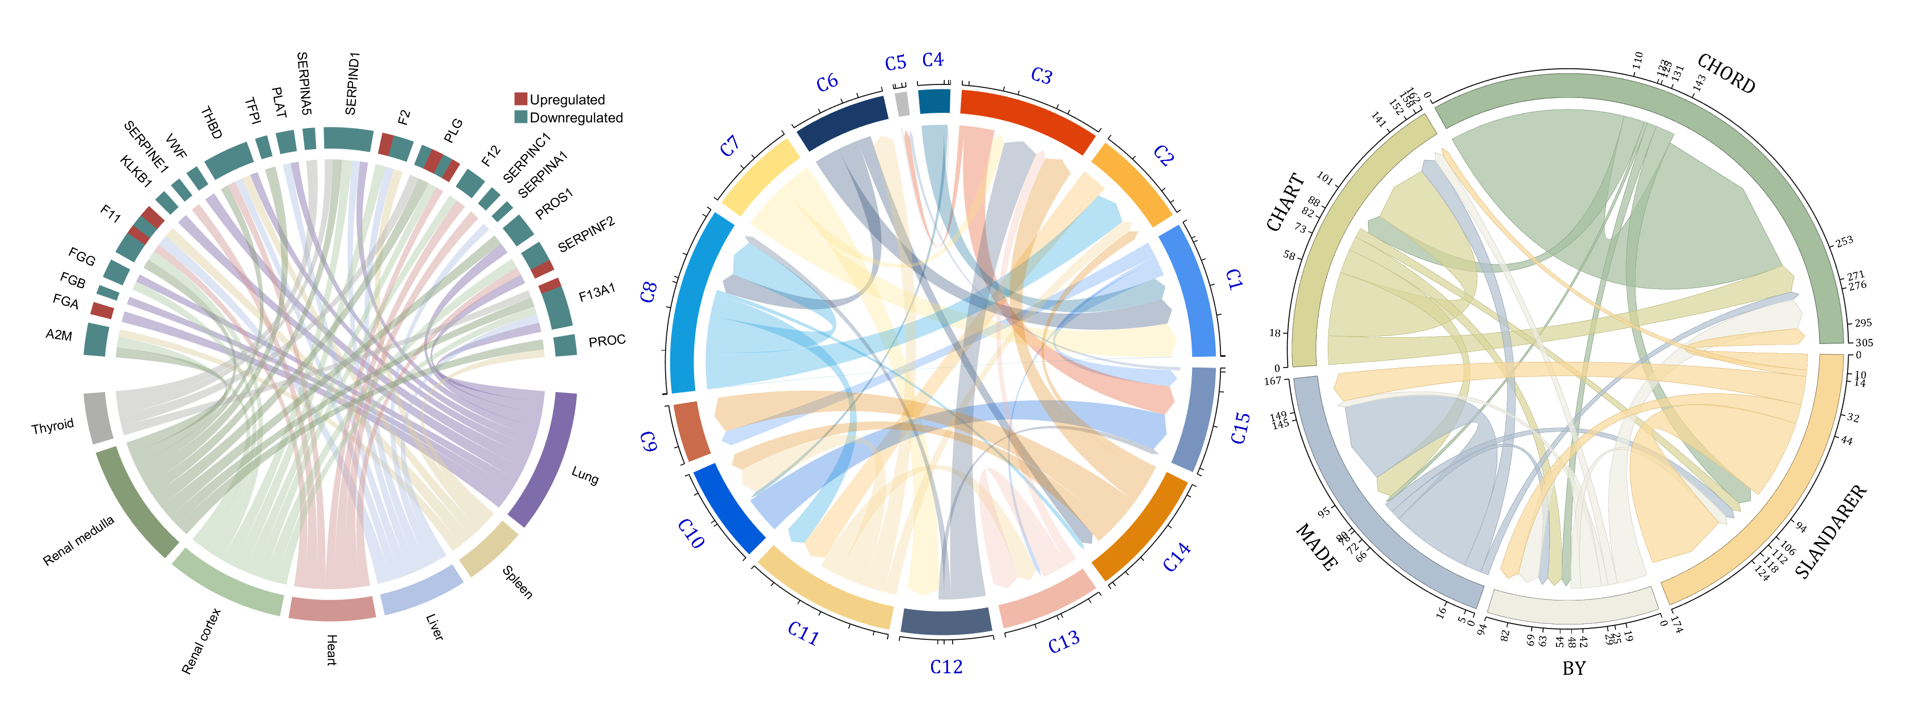

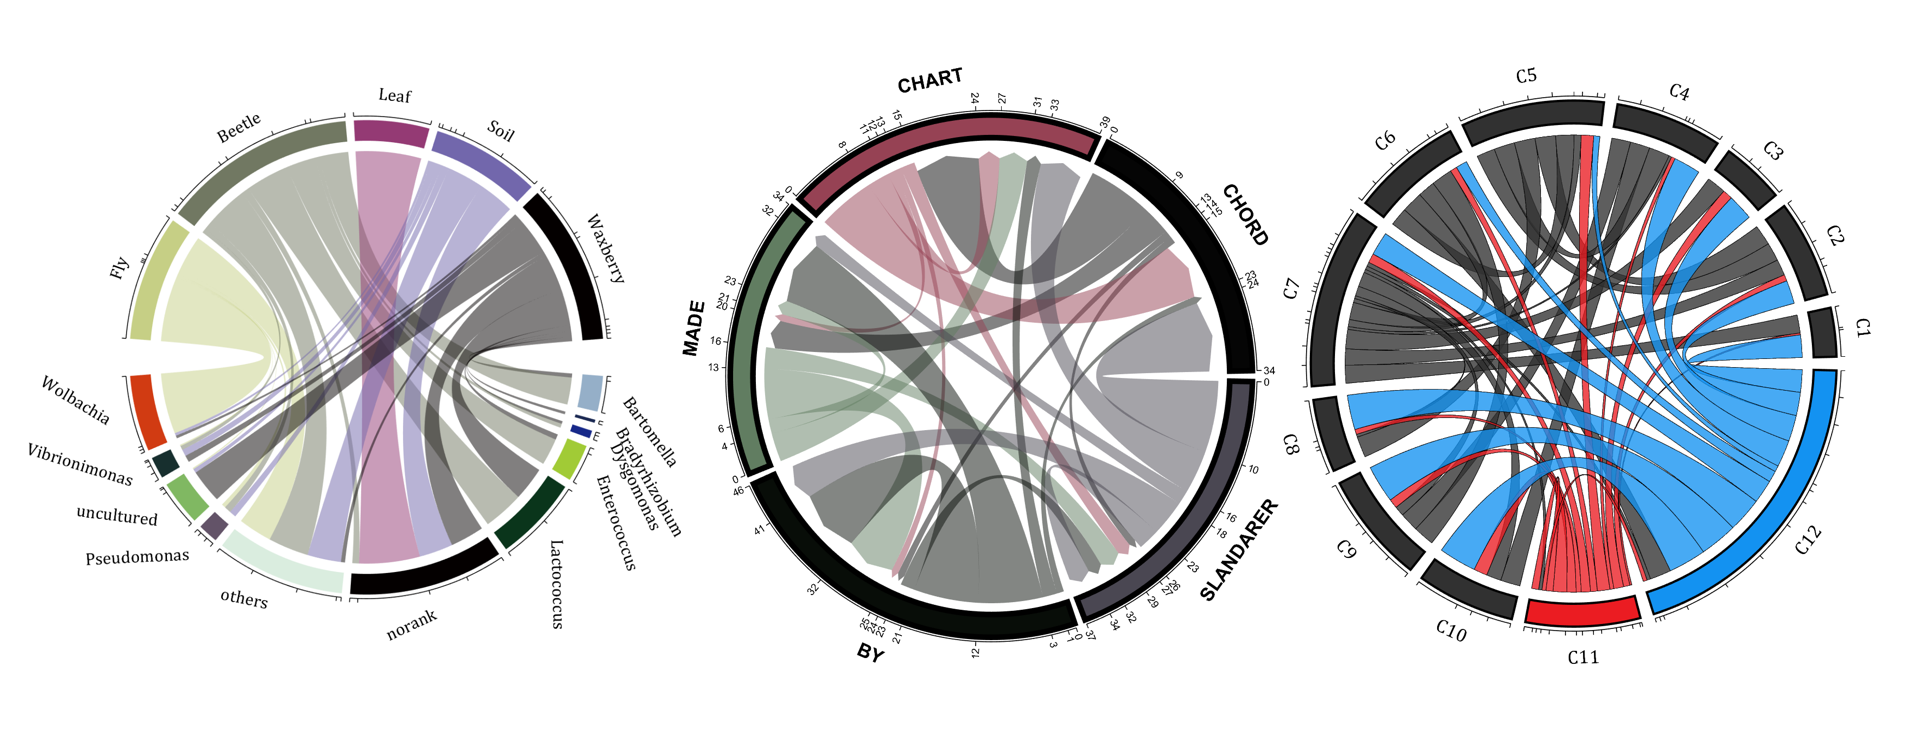
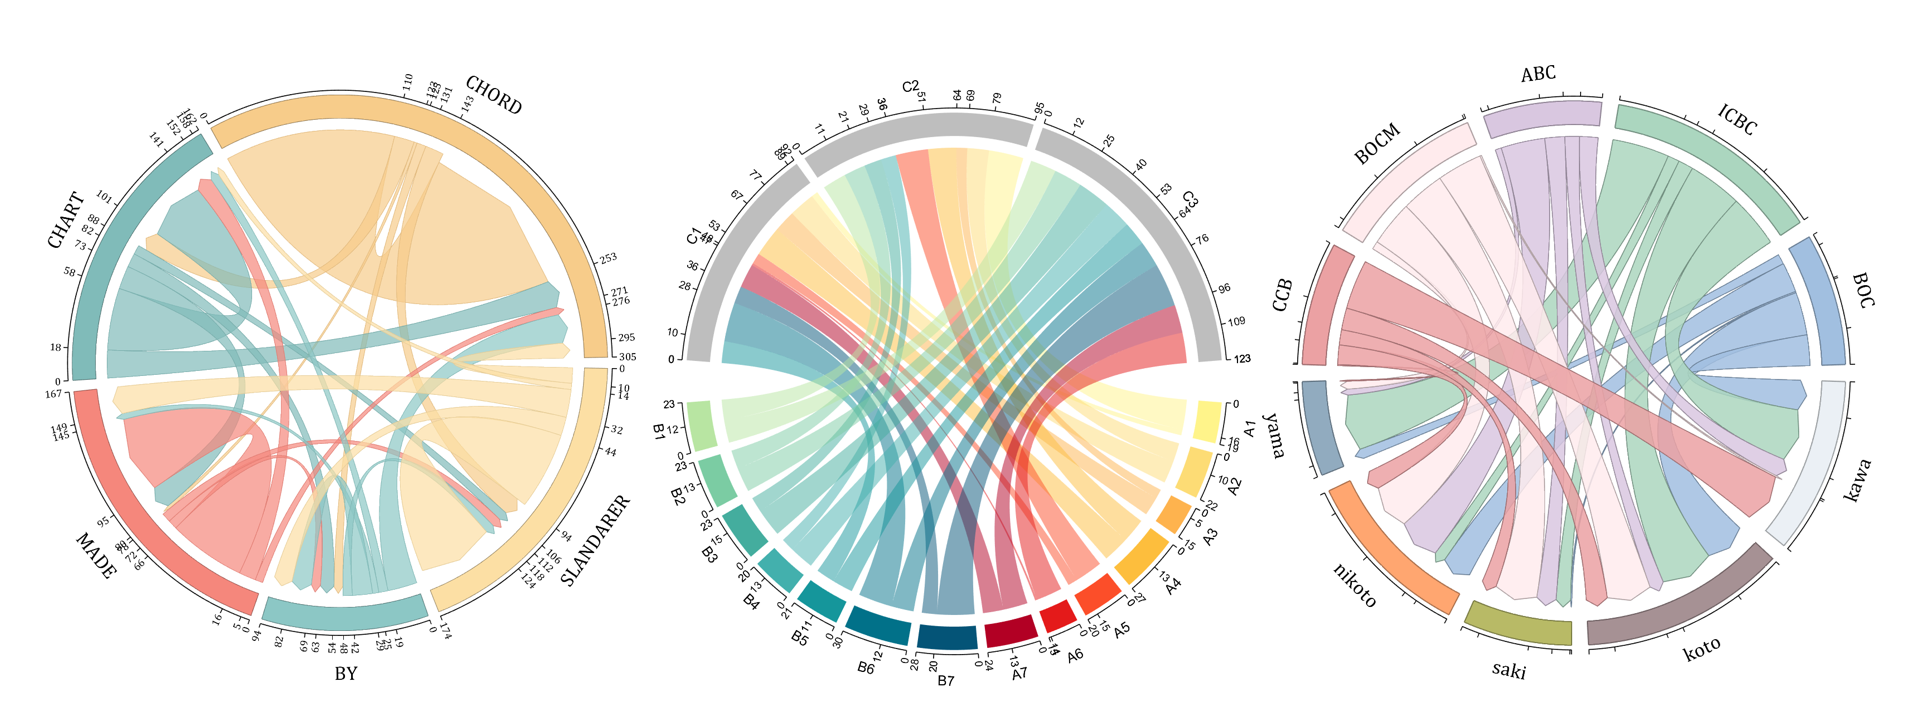
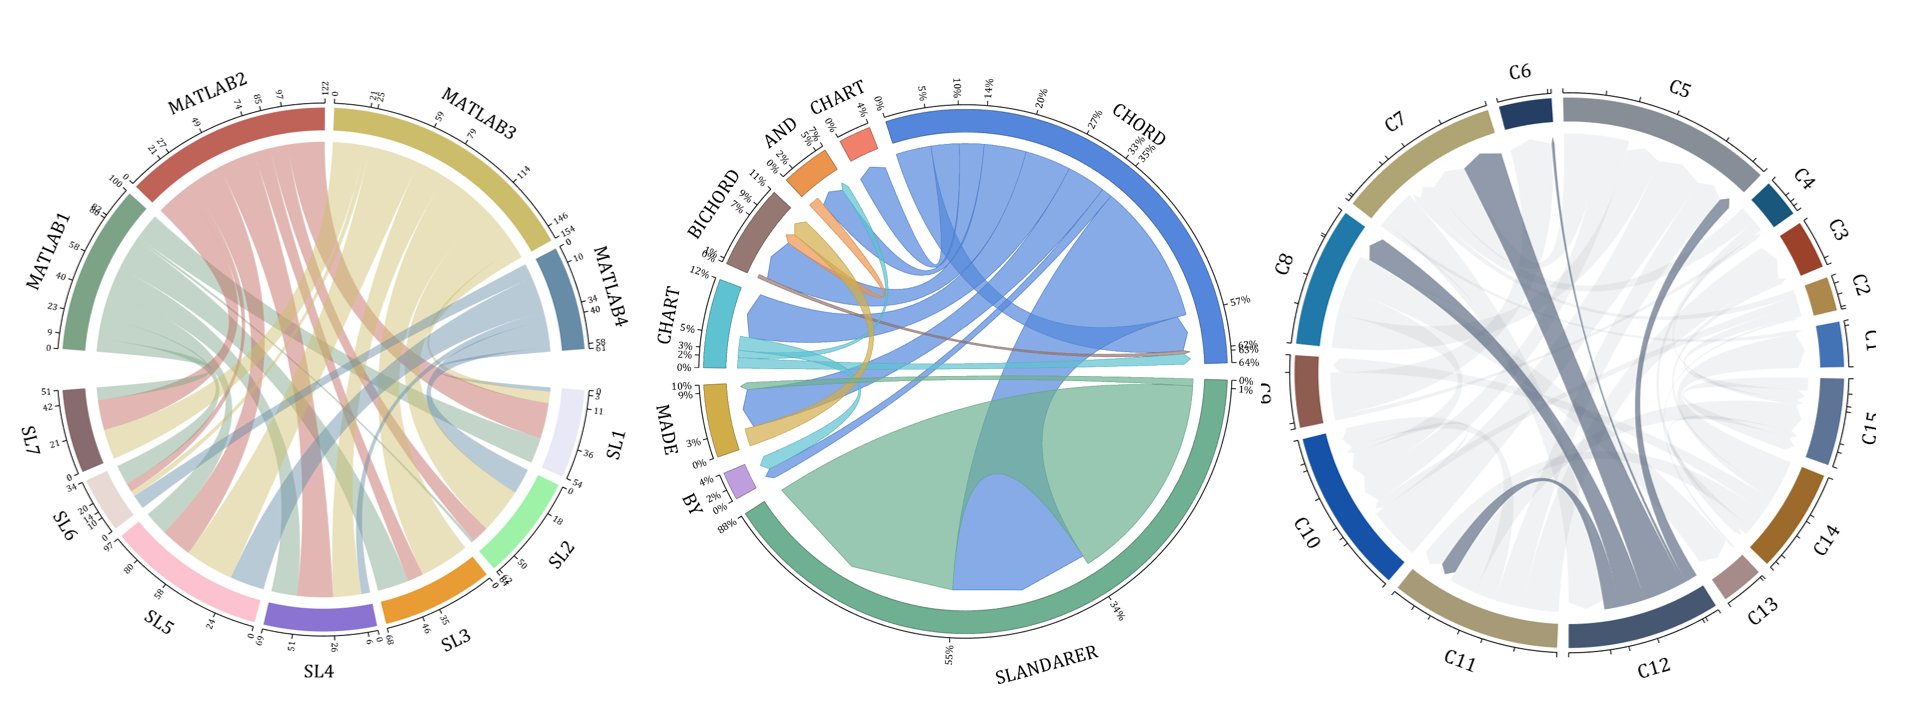
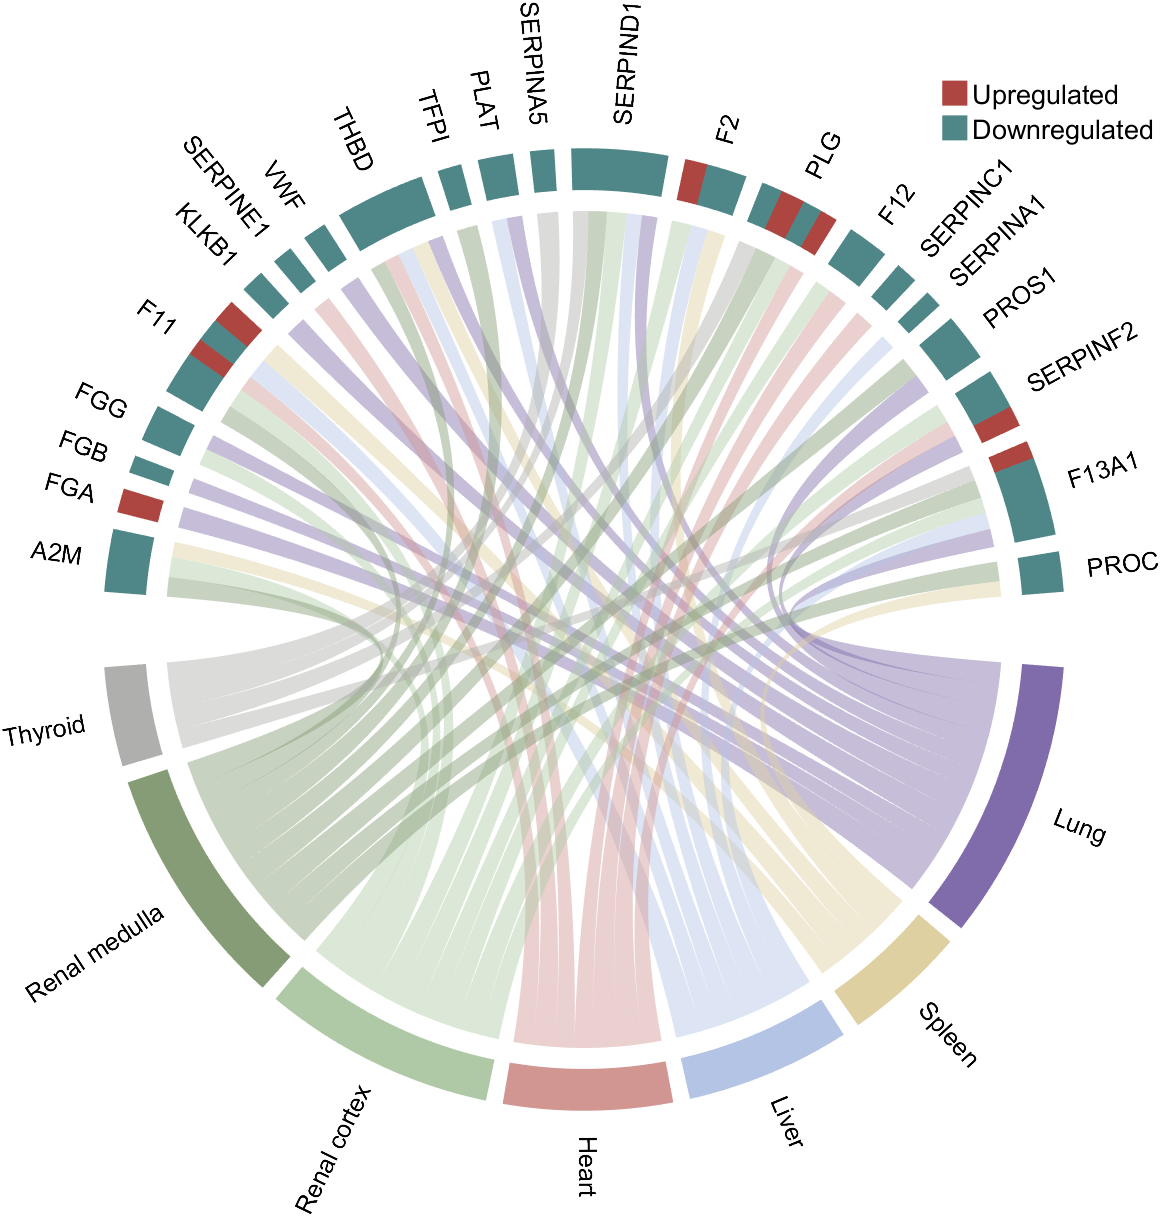
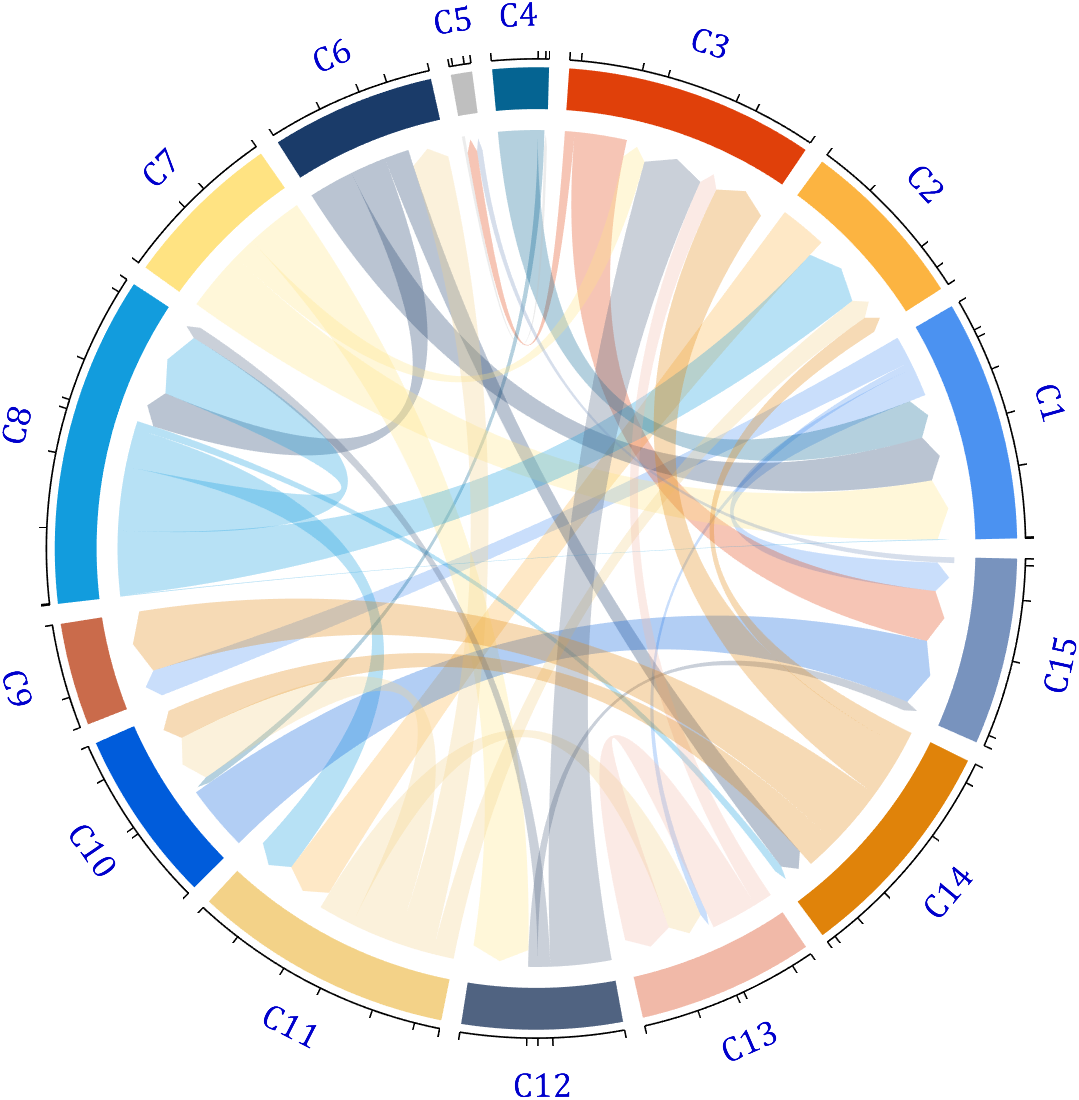
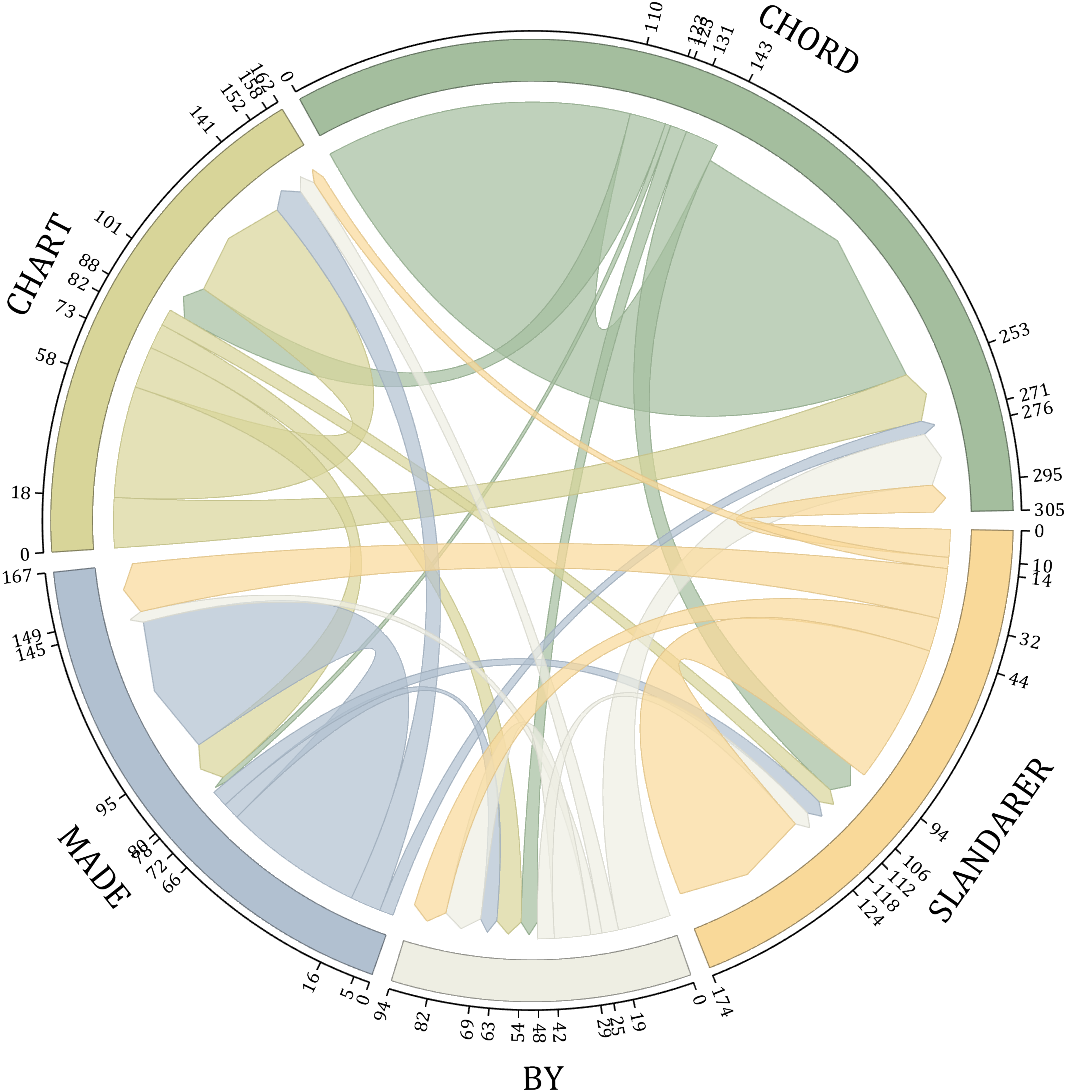
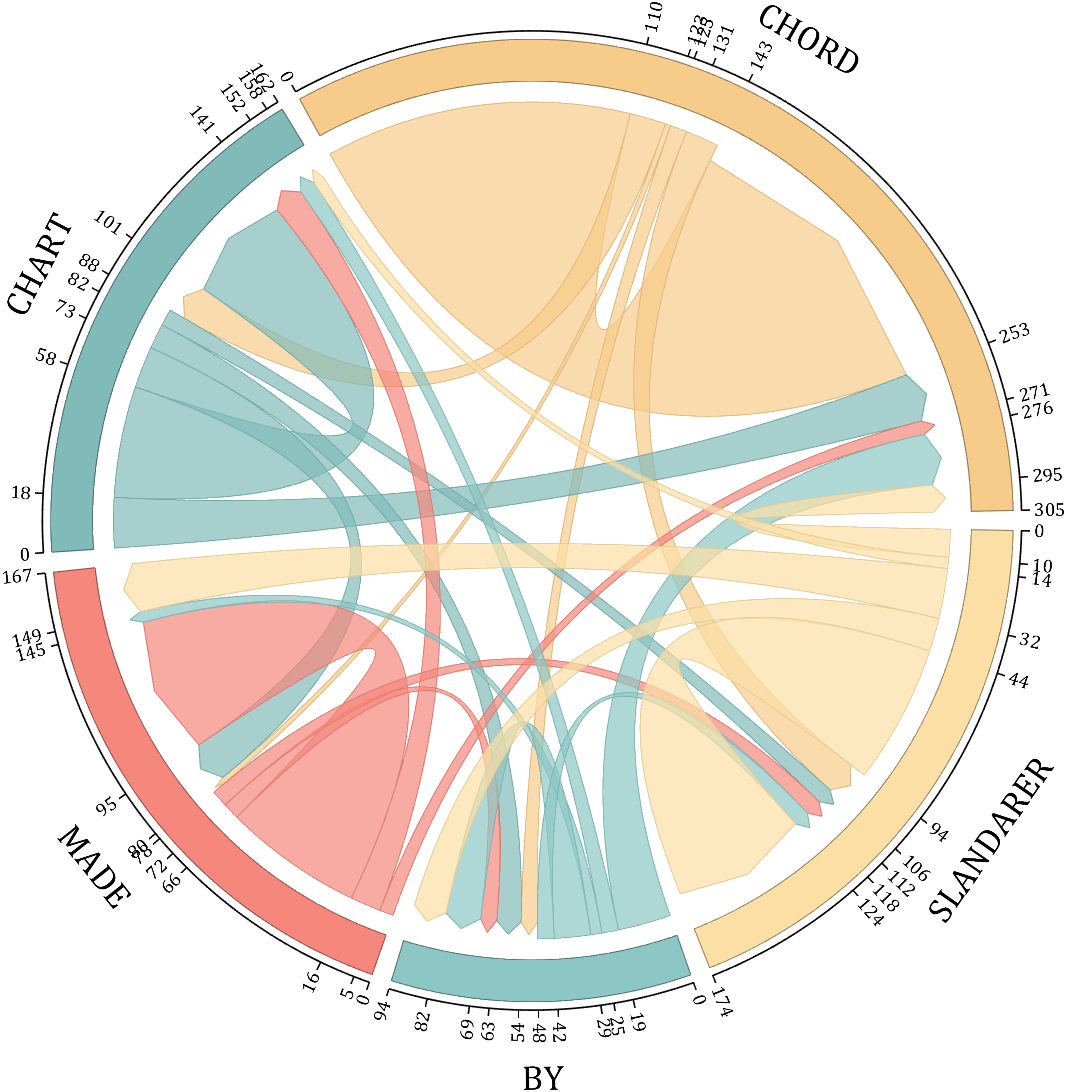
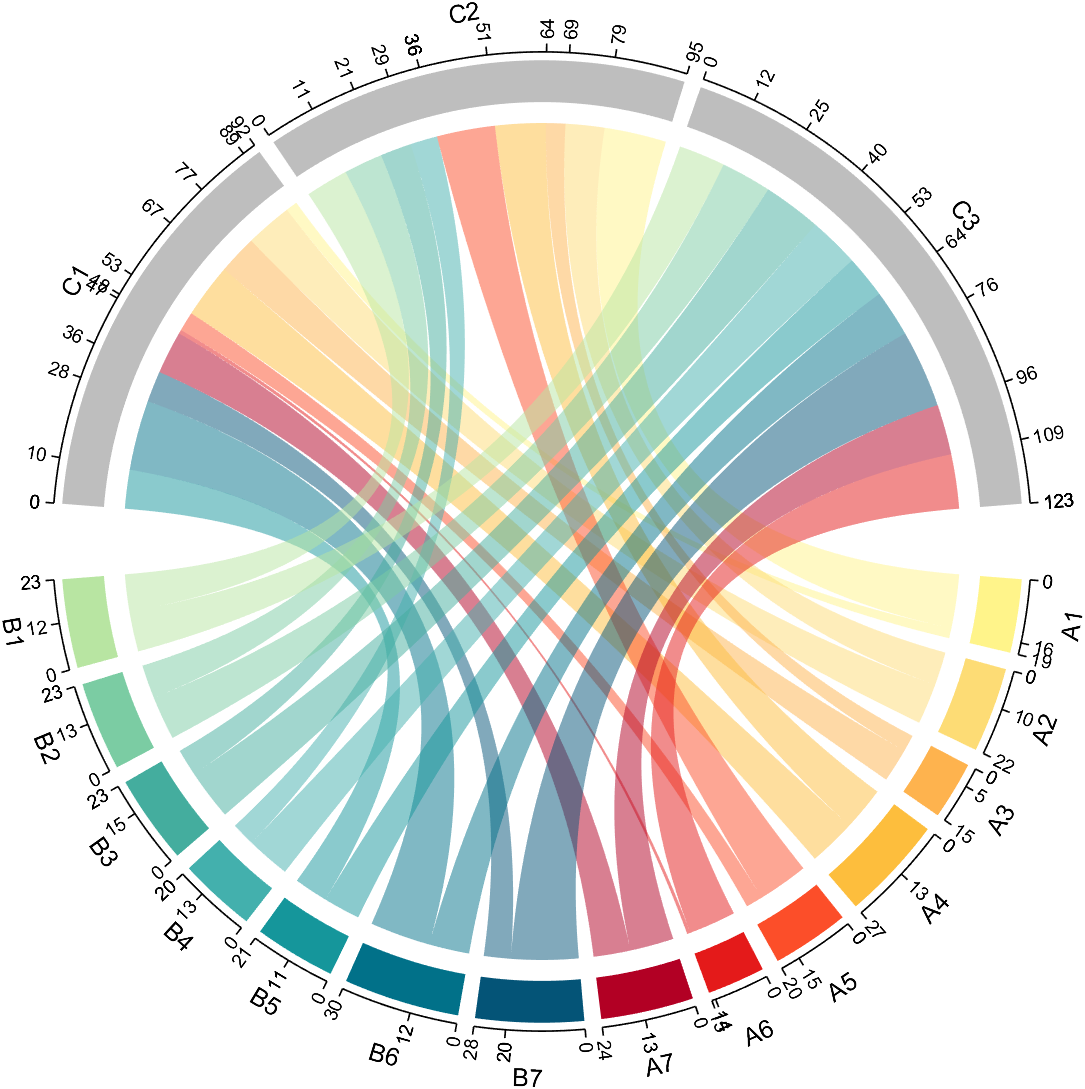
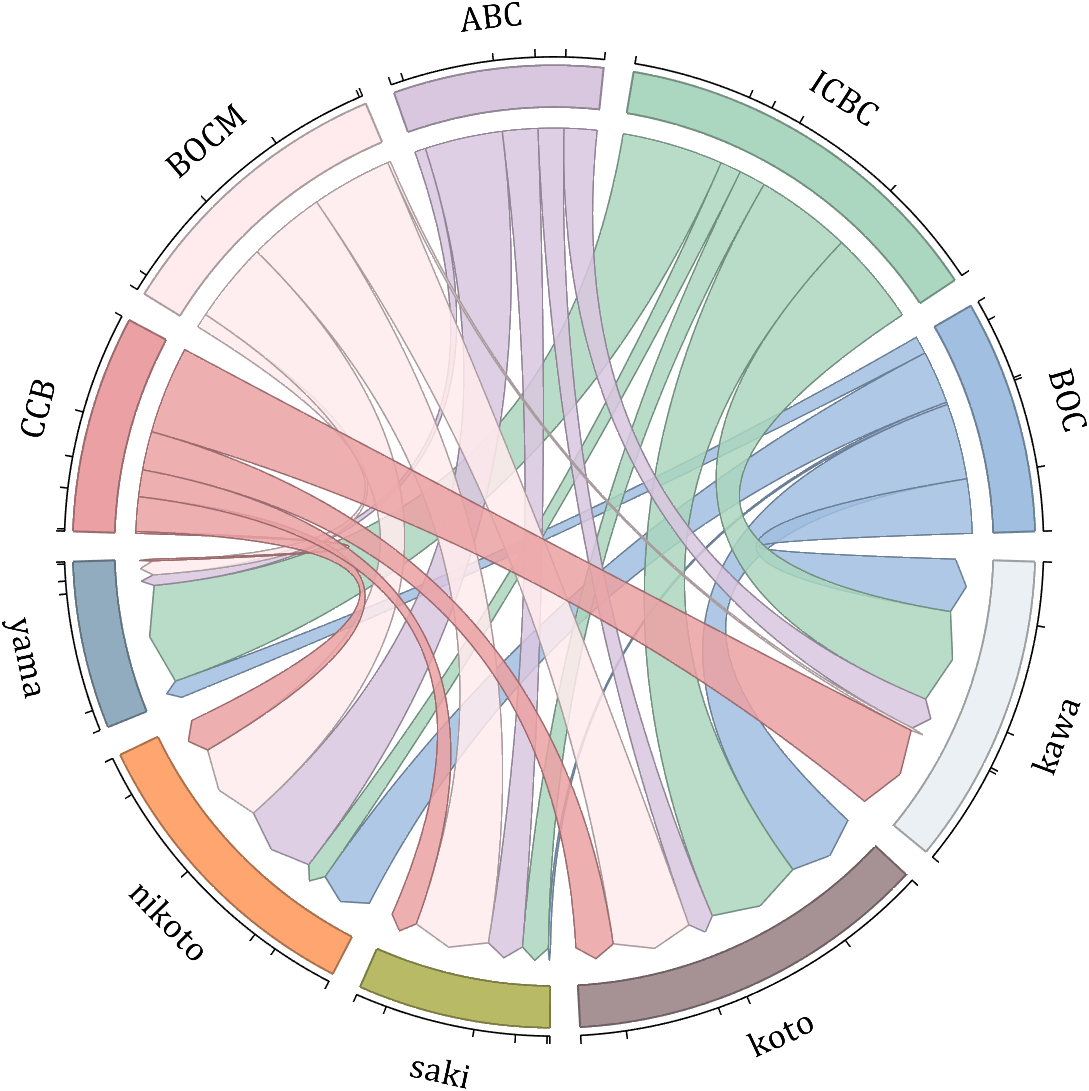
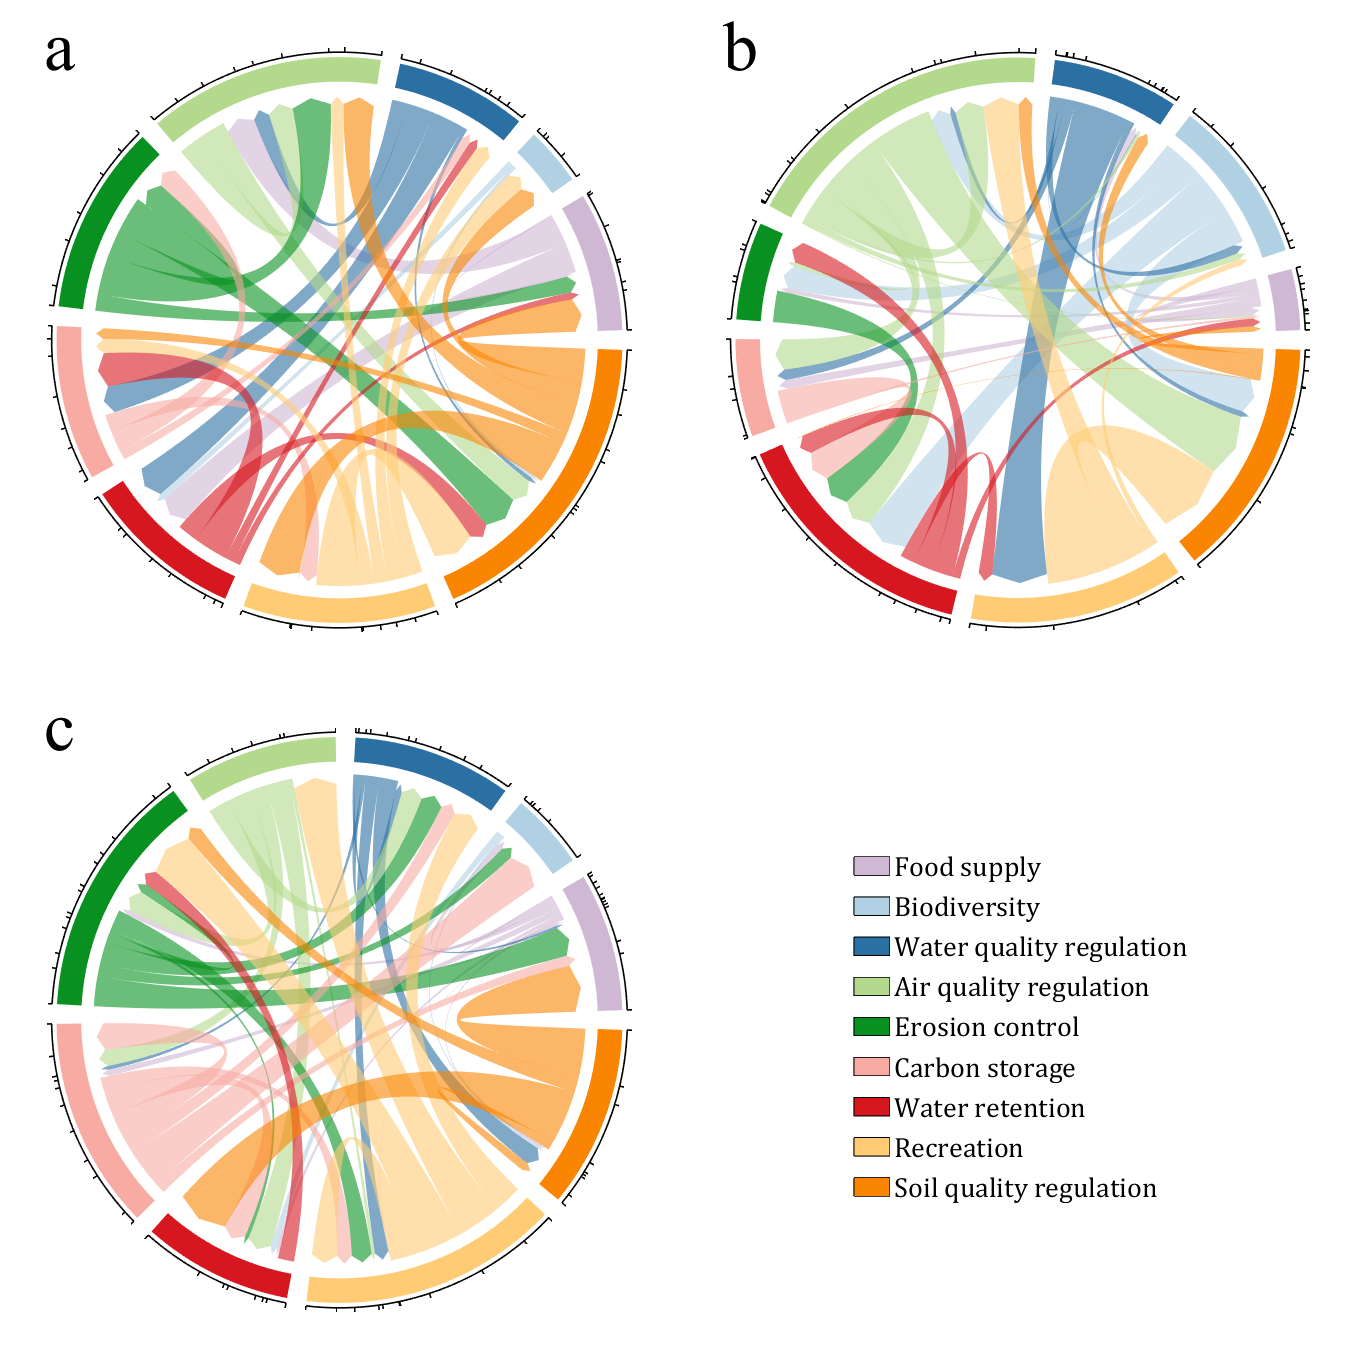
- - Chord chart: [chord chart](https://www.mathworks.com/matlabcentral/fileexchange/116550-chord-chart)
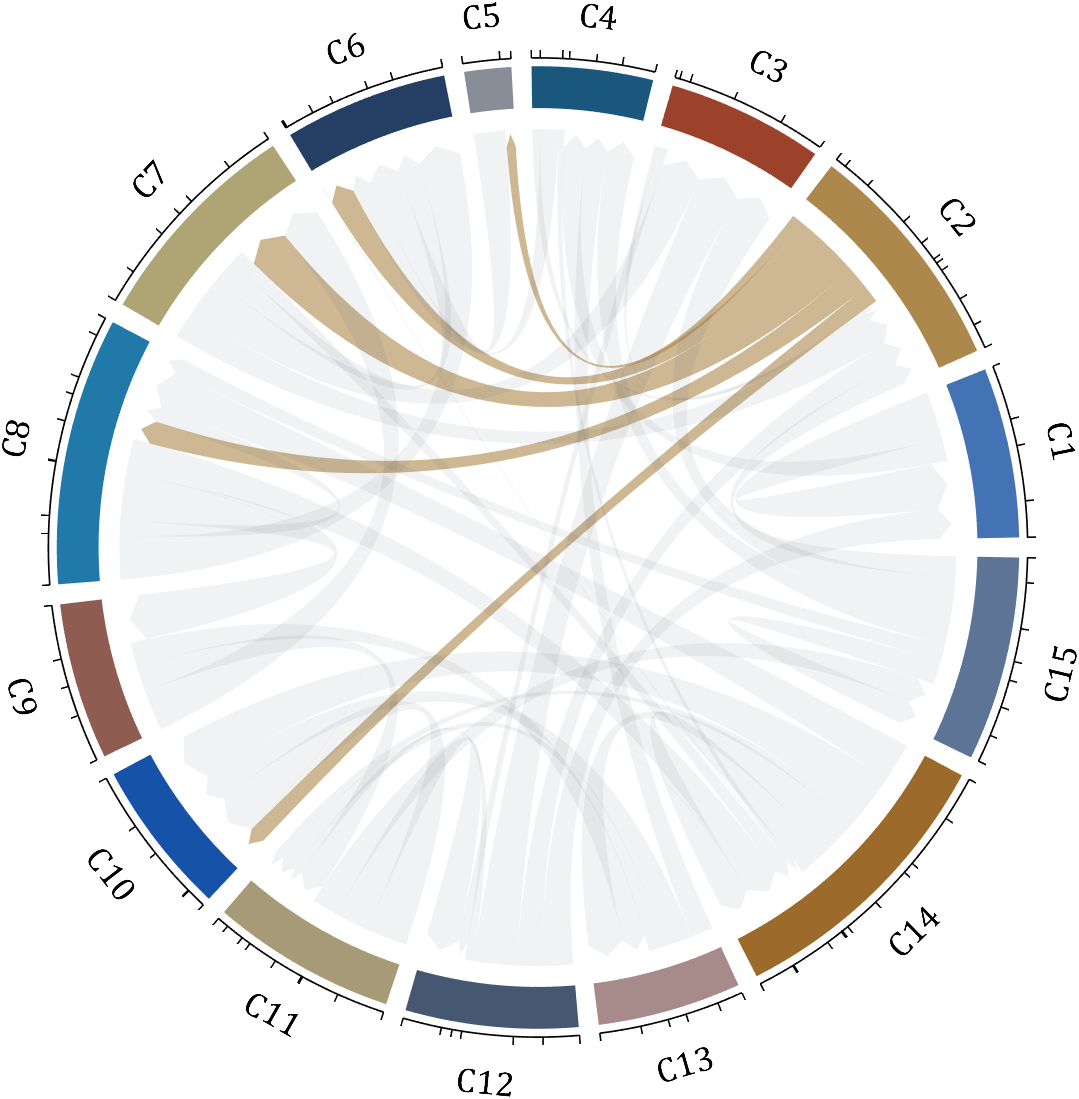
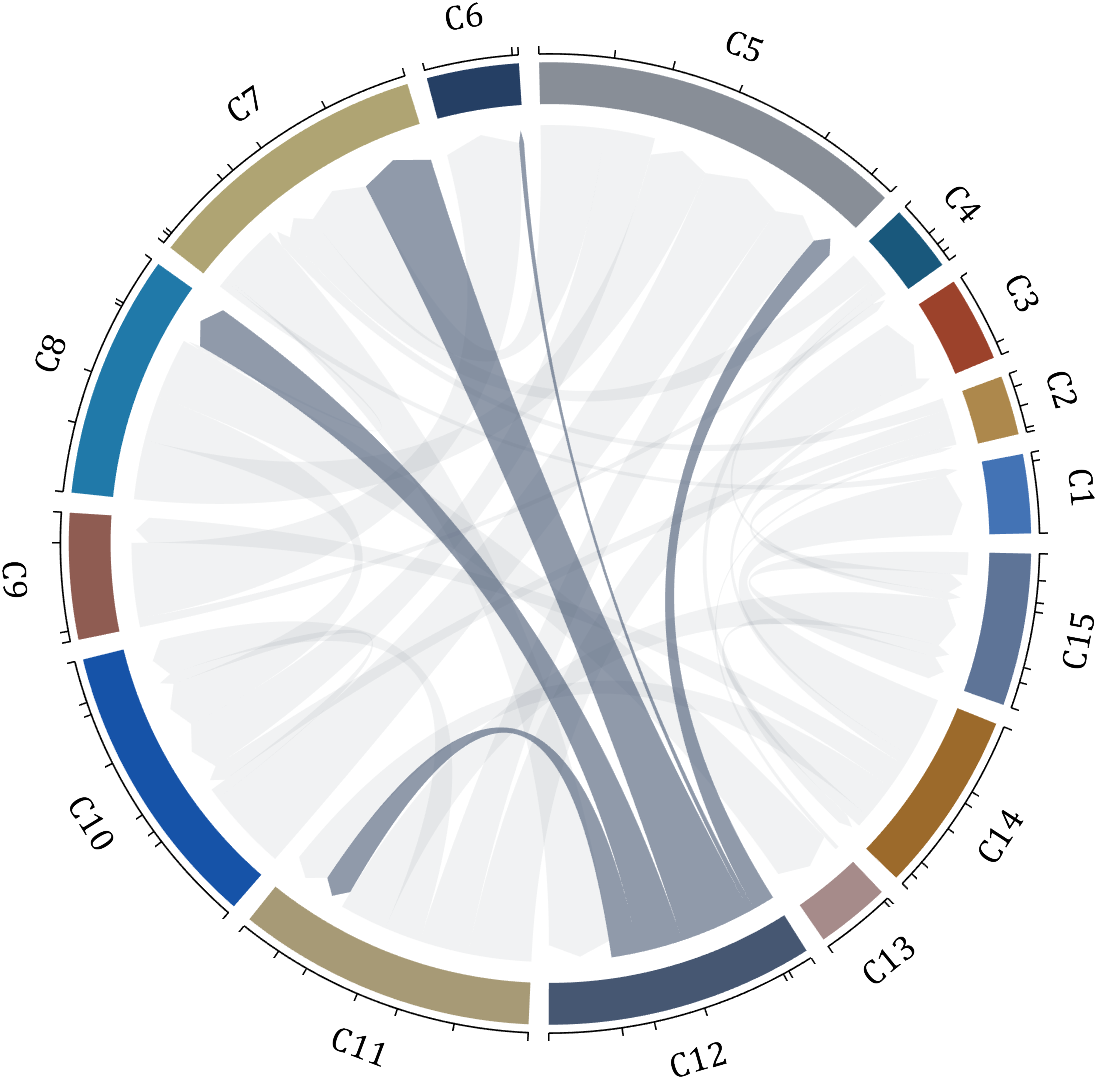
- - Directed graph chord chart: [digraph chord chart]:(https://www.mathworks.com/matlabcentral/fileexchange/121043-digraph-chord-chart)

- - Chord chart: [chord chart](https://www.mathworks.com/matlabcentral/fileexchange/116550-chord-chart)
- - Directed graph chord chart: [digraph chord chart]:(https://www.mathworks.com/matlabcentral/fileexchange/121043-digraph-chord-chart)


I have a Thingtweet: "Measurements %%datetime%% Comment" The tweet will send the time as say: 5:23pm I want it in 24hr format = 17:23 I have scoured the site and I cant find any way of doing this in a tweet. Also that would be local time, is it possible to use UTC ?
Bonjour, J'utilise arduino Mega 2560 avec le shield Ethernet. Le sketch ino joint ci-après me permet de visualiser la jauge dans la page index.htm chargée sur la carte SD. ThingSpeak affiche bien le graph correspondant. Mais ma page web n'y a pas accès. Comment intégrer les codes dans la page ou dans le sketch pour cela ? Je vous joins la capture d'écran de cette page ainsi que les codes De la page et du sketch. Merci pour votre aide.
*********************************** Code Page "index.htm" ***********************************
<!DOCTYPE html>
<html>
    <head>
        <title>Arduino Internet Voltmeter</title>
        <script>
		var data_val = 0;		// raw data from Arduino analog input (0 to 1023)
		var volts = 0;			// voltage calculated from Arduino analog raw data value
		var num_updates = 0;	// number of 200ms periods used to calculate time to send data to ThingSpeak
		// gauge code
		eval(function(p,a,c,k,e,r){e=function(c){return(c<a?'':e(parseInt(c/a)))+((c=c%a)>35?String.fromCharCode(c+29):c.toString(36))};if(!''.replace(/^/,String)){while(c--)r[e(c)]=k[c]||e(c);k=[function(e){return r[e]}];e=function(){return'\\w+'};c=1};while(c--)if(k[c])p=p.replace(new RegExp('\\b'+e(c)+'\\b','g'),k[c]);return p}('t W=v(f){W.2t.3T(A);A.B={Z:2u,19:1q,1h:1q,1J:U,1b:D,K:0,V:[\'0\',\'20\',\'40\',\'2A\',\'2B\',\'D\'],2r:10,2C:M,1E:U,2q:{2D:3,2E:2},2H:M,1c:{2j:10,2m:3y,2O:\'3v\'},J:{2P:\'#4h\',V:\'#31\',2r:\'#3k\',1J:\'#37\',1E:\'#37\',3e:\'#31\',1t:{2s:\'1e(3Y, 3d, 3d, 1)\',3c:\'1e(1Y, 5I, 5E, .9)\'}},1o:[{1n:20,1D:2A,1F:\'#3j\'},{1n:2A,1D:2B,1F:\'#36\'},{1n:2B,1D:D,1F:\'#5n\'}]};t g=0,1p=A,N=0,1S=0,1G=U;A.5d=v(a){N=f.1c?g:a;t b=(f.1b-f.K)/D;1S=a>f.1b?1S=f.1b+b:a<f.K?f.K-b:a;g=a;f.1c?3l():A.1g();C A};A.3m=v(a){N=g=a;A.1g();C A};A.4T=v(){g=N=1S=A.B.K;A.1g();C A};A.4R=v(){C g};A.13=v(){};v 2k(a,b){Q(t i 4P b){z(1H b[i]=="1W"&&!(4O.4y.2V.4p(b[i])===\'[1W 4n]\')&&i!=\'Z\'){z(1H a[i]!="1W"){a[i]={}}2k(a[i],b[i])}O{a[i]=b[i]}}};2k(A.B,f);A.B.K=1R(A.B.K);A.B.1b=1R(A.B.1b);f=A.B;N=g=f.K;z(!f.Z){4m 4j("4g 4d 4b 46 44 41 3Z 3W W 1W!");}t j=f.Z.5K?f.Z:2R.5v(f.Z),q=j.3u(\'2d\'),1i,1y,1A,14,17,u,1d;v 2M(){j.19=f.19;j.1h=f.1h;1i=j.4s(M);1d=1i.3u(\'2d\');1y=j.19;1A=j.1h;14=1y/2;17=1A/2;u=14<17?14:17;1i.2J=U;1d.3P(14,17);1d.G();q.3P(14,17);q.G()};2M();A.4Z=v(a){2k(A.B,a);2M();A.1g();C A};t k={4q:v(p){C p},4e:v(p){C E.1L(p,2)},4c:v(p){C E.1L(p,5)},3v:v(p){C 1-E.1O(E.5C(p))},5k:v(p){C 1-(v(p){Q(t a=0,b=1;1;a+=b,b/=2){z(p>=(7-4*a)/11){C-E.1L((11-6*a-11*p)/4,2)+E.1L(b,2)}}})(1-p)},4S:v(p){C 1-(v(p){t x=1.5;C E.1L(2,10*(p-1))*E.1T(20*E.1a*x/3*p)})(1-p)}};t l=2u;v 3S(d){t e=2v 3R;l=2x(v(){t a=2v 3R-e,1M=a/d.2m;z(1M>1){1M=1}t b=1H d.2g=="v"?d.2g:k[d.2g];t c=b(1M);d.3Q(c);z(1M==1){2b(l)}},d.2j||10)};v 3l(){l&&2b(l);t b=(1S-N),1n=N,29=f.1c;3S({2j:29.2j,2m:29.2m,2g:29.2O,3Q:v(a){N=1R(1n)+b*a;1p.1g()}})};q.5l="3O";A.1g=v(){z(!1i.2J){1d.3M(-14,-17,1y,1A);1d.G();t a=q;q=1d;3L();3K();3I();3H();3F();3D();3z();1i.2J=M;q=a;5G a}q.3M(-14,-17,1y,1A);q.G();q.4a(1i,-14,-17,1y,1A);z(!W.28){t b=2x(v(){z(!W.28){C}2b(b);2K();2L();z(!1G){1p.13&&1p.13();1G=M}},10)}O{2K();2L();z(!1G){1p.13&&1p.13();1G=M}}C A};v S(a){C a*E.1a/4J};v 1l(a,b,c){t d=q.4Y(0,0,0,c);d.1V(0,a);d.1V(1,b);C d};v 3L(){t a=u/D*5g,3x=u-a,2a=u/D*5q,5u=u-2a,1f=u/D*5z,5A=u-1f;3t=u/D*5F;q.G();z(f.2H){q.2o=3x;q.2n=\'1e(0, 0, 0, 0.5)\'}q.P();q.16(0,0,a,0,E.1a*2,M);q.L=1l(\'#42\',\'#43\',a);q.T();q.R();q.P();q.16(0,0,2a,0,E.1a*2,M);q.L=1l(\'#49\',\'#36\',2a);q.T();q.P();q.16(0,0,1f,0,E.1a*2,M);q.L=1l(\'#3j\',\'#3s\',1f);q.T();q.P();q.16(0,0,3t,0,E.1a*2,M);q.L=f.J.2P;q.T();q.G()};v 3H(){t r=u/D*2T;q.2e=2;q.2U=f.J.V;q.G();Q(t i=0;i<f.V.H;++i){t a=45+i*(1U/(f.V.H-1));q.1z(S(a));q.P();q.1K(0,r);q.F(0,r-u/D*15);q.1X();q.R();q.G()}z(f.2C){q.1z(S(2X));q.P();q.16(0,0,r,S(45),S(4N),U);q.1X();q.R();q.G()}};v 3I(){t r=u/D*2T;q.2e=1;q.2U=f.J.2r;q.G();t b=f.2r*(f.V.H-1);Q(t i=0;i<b;++i){t a=45+i*(1U/b);q.1z(S(a));q.P();q.1K(0,r);q.F(0,r-u/D*7.5);q.1X();q.R();q.G()}};v 3F(){t r=u/D*55;Q(t i=0;i<f.V.H;++i){t a=45+i*(1U/(f.V.H-1)),p=1w(r,S(a));q.1x=20*(u/1q)+"2i 2Y";q.L=f.J.3e;q.2e=0;q.2h="2f";q.27(f.V[i],p.x,p.y+3)}};v 3D(){z(!f.1J){C}q.G();q.1x=24*(u/1q)+"2i 2Y";q.L=f.J.1J;q.2h="2f";q.27(f.1J,0,-u/4.25);q.R()};v 3z(){z(!f.1E){C}q.G();q.1x=22*(u/1q)+"2i 2Y";q.L=f.J.1E;q.2h="2f";q.27(f.1E,0,u/3.25);q.R()};v 32(a){t b=f.2q.2E,34=f.2q.2D;a=1R(a);t n=(a<0);a=E.35(a);z(b>0){a=a.5t(b).2V().1j(\'.\');Q(t i=0,s=34-a[0].H;i<s;++i){a[0]=\'0\'+a[0]}a=(n?\'-\':\'\')+a[0]+\'.\'+a[1]}O{a=E.3O(a).2V();Q(t i=0,s=34-a.H;i<s;++i){a=\'0\'+a}a=(n?\'-\':\'\')+a}C a};v 1w(r,a){t x=0,y=r,1O=E.1O(a),1T=E.1T(a),X=x*1T-y*1O,Y=x*1O+y*1T;C{x:X,y:Y}};v 3K(){q.G();t a=u/D*2T;t b=a-u/D*15;Q(t i=0,s=f.1o.H;i<s;i++){t c=f.1o[i],39=(f.1b-f.K)/1U,1P=S(45+(c.1n-f.K)/39),1N=S(45+(c.1D-f.K)/39);q.P();q.1z(S(2X));q.16(0,0,a,1P,1N,U);q.R();q.G();t d=1w(b,1P),3a=1w(a,1P);q.1K(d.x,d.y);q.F(3a.x,3a.y);t e=1w(a,1N),3b=1w(b,1N);q.F(e.x,e.y);q.F(3b.x,3b.y);q.F(d.x,d.y);q.1C();q.L=c.1F;q.T();q.P();q.1z(S(2X));q.16(0,0,b,1P-0.2,1N+0.2,U);q.R();q.1C();q.L=f.J.2P;q.T();q.G()}};v 2L(){t a=u/D*12,1f=u/D*8,1u=u/D*3X,1r=u/D*20,2l=u/D*4,1B=u/D*2,38=v(){q.3f=2;q.3g=2;q.2o=10;q.2n=\'1e(5L, 3h, 3h, 0.45)\'};38();q.G();z(N<0){N=E.35(f.K-N)}O z(f.K>0){N-=f.K}O{N=E.35(f.K)+N}q.1z(S(45+N/((f.1b-f.K)/1U)));q.P();q.1K(-1B,-1r);q.F(-2l,0);q.F(-1,1u);q.F(1,1u);q.F(2l,0);q.F(1B,-1r);q.1C();q.L=1l(f.J.1t.2s,f.J.1t.3c,1u-1r);q.T();q.P();q.F(-0.5,1u);q.F(-1,1u);q.F(-2l,0);q.F(-1B,-1r);q.F(1B/2-2,-1r);q.1C();q.L=\'1e(1Y, 1Y, 1Y, 0.2)\';q.T();q.R();38();q.P();q.16(0,0,a,0,E.1a*2,M);q.L=1l(\'#3s\',\'#36\',a);q.T();q.R();q.P();q.16(0,0,1f,0,E.1a*2,M);q.L=1l("#47","#48",1f);q.T()};v 3i(x,y,w,h,r){q.P();q.1K(x+r,y);q.F(x+w-r,y);q.23(x+w,y,x+w,y+r);q.F(x+w,y+h-r);q.23(x+w,y+h,x+w-r,y+h);q.F(x+r,y+h);q.23(x,y+h,x,y+h-r);q.F(x,y+r);q.23(x,y,x+r,y);q.1C()};v 2K(){q.G();q.1x=40*(u/1q)+"2i 30";t a=32(g),2Z=q.4f(\'-\'+32(0)).19,y=u-u/D*33,x=0,2W=0.12*u;q.G();3i(-2Z/2-0.21*u,y-2W-0.4i*u,2Z+0.3n*u,2W+0.4k*u,0.21*u);t b=q.4l(x,y-0.12*u-0.21*u+(0.12*u+0.3o*u)/2,u/10,x,y-0.12*u-0.21*u+(0.12*u+0.3o*u)/2,u/5);b.1V(0,"#37");b.1V(1,"#3k");q.2U=b;q.2e=0.3n*u;q.1X();q.2o=0.3p*u;q.2n=\'1e(0, 0, 0, 1)\';q.L="#4o";q.T();q.R();q.3f=0.3q*u;q.3g=0.3q*u;q.2o=0.3p*u;q.2n=\'1e(0, 0, 0, 0.3)\';q.L="#31";q.2h="2f";q.27(a,-x,y);q.R()}};W.28=U;(v(){t d=2R,h=d.3r(\'4r\')[0],2S=4t.4u.4v().4w(\'4x\')!=-1,2Q=\'4z://4A-4B.4C/4D/4E/4F-7-4G.\'+(2S?\'4H\':\'4I\'),1I="@1x-4K {"+"1x-4L: \'30\';"+"4M: 2Q(\'"+2Q+"\');"+"}",1s,r=d.3w(\'1v\');r.2N=\'1I/4Q\';z(2S){h.2p(r);1s=r.2I;1s.3A=1I}O{4U{r.2p(d.4V(1I))}4W(e){r.3A=1I}h.2p(r);1s=r.2I?r.2I:(r.4X||d.3B[d.3B.H-1])}t b=2x(v(){z(!d.3C){C}2b(b);t a=d.3w(\'50\');a.1v.51=\'30\';a.1v.52=\'53\';a.1v.1h=a.1v.19=0;a.1v.54=\'56\';a.57=\'.\';d.3C.2p(a);58(v(){W.28=M;a.59.5a(a)},3y)},1)})();W.2t=[];W.2t.5b=v(a){z(1H(a)==\'5c\'){Q(t i=0,s=A.H;i<s;i++){z(A[i].B.Z.18(\'5e\')==a){C A[i]}}}O z(1H(a)==\'5f\'){C A[a]}O{C 2u}};v 3E(a){z(2G.3G){2G.3G(\'5h\',a,U)}O{2G.5i(\'5j\',a)}}3E(v(){v 2F(a){t b=a[0];Q(t i=1,s=a.H;i<s;i++){b+=a[i].1Z(0,1).5m()+a[i].1Z(1,a[i].H-1)}C b};v 3J(a){C a.5o(/^\\s+|\\s+$/g,\'\')};t c=2R.3r(\'5p\');Q(t i=0,s=c.H;i<s;i++){z(c[i].18(\'1k-2N\')==\'5r-5s\'){t d=c[i],B={},1m,w=2c(d.18(\'19\')),h=2c(d.18(\'1h\'));B.Z=d;z(w){B.19=w}z(h){B.1h=h}Q(t e=0,1s=d.3N.H;e<1s;e++){1m=d.3N.5w(e).5x;z(1m!=\'1k-2N\'&&1m.1Z(0,5)==\'1k-\'){t f=1m.1Z(5,1m.H-5).5y().1j(\'-\'),I=d.18(1m);z(!I){2z}5B(f[0]){2y\'J\':{z(f[1]){z(!B.J){B.J={}}z(f[1]==\'1t\'){t k=I.1j(/\\s+/);z(k[0]&&k[1]){B.J.1t={2s:k[0],3c:k[1]}}O{B.J.1t=I}}O{f.5D();B.J[2F(f)]=I}}26}2y\'1o\':{z(!B.1o){B.1o=[]}2w=I.1j(\',\');Q(t j=0,l=2w.H;j<l;j++){t m=3J(2w[j]).1j(/\\s+/),1Q={};z(m[0]&&m[0]!=\'\'){1Q.1n=m[0]}z(m[1]&&m[1]!=\'\'){1Q.1D=m[1]}z(m[2]&&m[2]!=\'\'){1Q.1F=m[2]}B.1o.3T(1Q)}26}2y\'1c\':{z(f[1]){z(!B.1c){B.1c={}}z(f[1]==\'2O\'&&/^\\s*v\\s*\\(/.5H(I)){I=3U(\'(\'+I+\')\')}B.1c[f[1]]=I}26}5J:{t n=2F(f);z(n==\'13\'){2z}z(n==\'V\'){I=I.1j(/\\s+/)}O z(n==\'2C\'||n==\'2H\'){I=I==\'M\'?M:U}O z(n==\'2q\'){t o=I.1j(\'.\');z(o.H==2){I={2D:2c(o[0]),2E:2c(o[1])}}O{2z}}B[n]=I;26}}}}t g=2v W(B);z(d.18(\'1k-3V\')){g.3m(1R(d.18(\'1k-3V\')))}z(d.18(\'1k-13\')){g.13=v(){3U(A.B.Z.18(\'1k-13\'))}}g.1g()}}});',62,358,'||||||||||||||||||||||||||ctx|||var|max|function||||if|this|config|return|100|Math|lineTo|save|length|attrValue|colors|minValue|fillStyle|true|fromValue|else|beginPath|for|restore|radians|fill|false|majorTicks|Gauge|||renderTo||||onready|CX||arc|CY|getAttribute|width|PI|maxValue|animation|cctx|rgba|r2|draw|height|cache|split|data|lgrad|prop|from|highlights|self|200|rOut|ss|needle|rIn|style|rpoint|font|CW|rotate|CH|pad2|closePath|to|units|color|imready|typeof|text|title|moveTo|pow|progress|ea|sin|sa|hlCfg|parseFloat|toValue|cos|270|addColorStop|object|stroke|255|substr||025||quadraticCurveTo|||break|fillText|initialized|cfg|r1|clearInterval|parseInt||lineWidth|center|delta|textAlign|px|delay|applyRecursive|pad1|duration|shadowColor|shadowBlur|appendChild|valueFormat|minorTicks|start|Collection|null|new|hls|setInterval|case|continue|60|80|strokeTicks|int|dec|toCamelCase|window|glow|styleSheet|i8d|drawValueBox|drawNeedle|baseInit|type|fn|plate|url|document|ie|81|strokeStyle|toString|th|90|Arial|tw|Led|444|padValue||cint|abs|ccc|888|shad|vd|pe|pe1|end|128|numbers|shadowOffsetX|shadowOffsetY|143|roundRect|eee|666|animate|setRawValue|05|045|012|004|getElementsByTagName|f0f0f0|r3|getContext|cycle|createElement|d0|250|drawUnits|cssText|styleSheets|body|drawTitle|domReady|drawNumbers|addEventListener|drawMajorTicks|drawMinorTicks|trim|drawHighlights|drawPlate|clearRect|attributes|round|translate|step|Date|_animate|push|eval|value|the|77|240|creating||when|ddd|aaa|specified||not|e8e8e8|f5f5f5|fafafa|drawImage|was|quint|element|quad|measureText|Canvas|fff|04|Error|07|createRadialGradient|throw|Array|babab2|call|linear|head|cloneNode|navigator|userAgent|toLocaleLowerCase|indexOf|msie|prototype|http|smart|ip|net|styles|fonts|digital|mono|eot|ttf|180|face|family|src|315|Object|in|css|getValue|elastic|clear|try|createTextNode|catch|sheet|createLinearGradient|updateConfig|div|fontFamily|position|absolute|overflow||hidden|innerHTML|setTimeout|parentNode|removeChild|get|string|setValue|id|number|93|DOMContentLoaded|attachEvent|onload|bounce|lineCap|toUpperCase|999|replace|canvas|91|canv|gauge|toFixed|d1|getElementById|item|nodeName|toLowerCase|88|d2|switch|acos|shift|122|85|delete|test|160|default|tagName|188'.split('|'),0,{}))
		// function called periodically to get analog value from Arduino using Ajax
		function GetArduinoInputs()
		{
			nocache = "&nocache=" + Math.random() * 1000000;
			var request = new XMLHttpRequest();
			request.onreadystatechange = function()
			{
				if (this.readyState == 4) {
					if (this.status == 200) {
						if (this.responseXML != null) {
							document.getElementById("input3").innerHTML =
								this.responseXML.getElementsByTagName('analog')[0].childNodes[0].nodeValue;
								data_val = this.responseXML.getElementsByTagName('analog')[0].childNodes[0].nodeValue;
								// calculate voltage
								volts = data_val * 3.5 / 1023;
								// only send data to ThingSpeak every 20 seconds or 100 x 200ms
								if (num_updates >= 100) {
									num_updates = 0;
									// send voltage to ThingSpeak
								ThingSpeakSend("xxxxxxxxxxxxxxxx", volts);	// insert your ThingSpeak Write API Key here

								}
								num_updates++;
						}
					}
				}
			}
			request.open("GET", "ajax_inputs" + nocache, true);
			request.send(null);
			setTimeout('GetArduinoInputs()', 200);	// send the request for Arduino analog data every 200ms

		}
		// function to send data to ThingSpeak
		function ThingSpeakSend(api_write_key, voltage)
		{
			var ts_req = new XMLHttpRequest();
			// GET request string - modify if more fields are needed
			var req_str = "http://api.thingspeak.com/update?key=" + api_write_key + "&field1=" + voltage;
			ts_req.onreadystatechange = function()
			{
				// not doing anything with response from ThingSpeak
			}
			// send the data to ThingSpeak
			ts_req.open("GET", req_str, true);
			ts_req.send(null);
		}
	</script>
    </head>
    <body onload="GetArduinoInputs()">
        <h1>Arduino Internet Voltmeter</h1>
        <p>Analog (A2): <span id="input3">...</span></p>
        <canvas id="an_gauge_1" data-major-ticks="0 0.5 1 1.5 2 2.5 3 3.5" data-type="canv-gauge" data-min-value="0" data-max-value="3.5" data-onready="setInterval( function() { Gauge.Collection.get('an_gauge_1').setValue(volts);}, 200);"></canvas>
        <!-- insert ThingSpeak chart code here -->
          <iframe width="450" height="260" style="border: 1px solid #cccccc;" src="https://thingspeak.com/channels/1620920/charts/1?bgcolor=%23ffffff&color=%23d62020&dynamic=true&results=60&type=line&update=20&yaxismax=4&yaxismin=0"></iframe>
  <!-- REPLACE THIS COMMENT WITH YOUR THINGSPEAK GRAPH -->
      </body>
  </html>
********************************************* Code "eth_websrv_SD_Ajax_gauge.ino" : *********************************************
#include <Ethernet.h>
#include <SD.h>
#include <ThingSpeak.h>
// size of buffer used to capture HTTP requests
#define REQ_BUF_SZ   50
// MAC address from Ethernet shield sticker under board
byte mac[] = { 0x90, 0xA2, 0xDA, 0x00, 0x1A, 0x71 };
IPAddress ip(192, 168, 1, 17); // IP address, may need to change depending on network
EthernetServer server(80);  // create a server at port 80
File webFile;               // the web page file on the SD card
char HTTP_req[REQ_BUF_SZ] = {0}; // buffered HTTP request stored as null terminated string
char req_index = 0;              // index into HTTP_req buffer
void setup()
{
  // disable Ethernet chip
  pinMode(10, OUTPUT);
  digitalWrite(10, HIGH);
Serial.begin(9600); // for debugging
    // initialize SD card
    Serial.println("Initializing SD card...");
    if (!SD.begin(4)) {
        Serial.println("ERROR - SD card initialization failed!");
        return;    // init failed
    }
    Serial.println("SUCCESS - SD card initialized.");
    // check for index.htm file
    if (!SD.exists("index.htm")) {
        Serial.println("ERROR - Can't find index.htm file!");
        return;  // can't find index file
    }
    Serial.println("SUCCESS - Found index.htm file.");
Ethernet.begin(mac, ip); // initialize Ethernet device
server.begin(); // start to listen for clients
Serial.print ("*\n -> Le serveur est sur l'adresse : ");
Serial.println(Ethernet.localIP());
}void loop()
{
EthernetClient client = server.available(); // try to get client
    if (client)   // got client?
        {
          boolean currentLineIsBlank = true;
while (client.connected())
{
if (client.available()) // client data available to read
{
char c = client.read(); // read 1 byte (character) from client
// buffer first part of HTTP request in HTTP_req array (string)
// leave last element in array as 0 to null terminate string (REQ_BUF_SZ - 1)
if (req_index < (REQ_BUF_SZ - 1)) {
HTTP_req[req_index] = c; // save HTTP request character
req_index++;
}
// last line of client request is blank and ends with \n
// respond to client only after last line received
if (c == '\n' && currentLineIsBlank) {
// send a standard http response header
client.println("HTTP/1.1 200 OK");
// remainder of header follows below, depending on if
// web page or XML page is requested
// Ajax request - send XML file
if (StrContains(HTTP_req, "ajax_inputs")) {
// send rest of HTTP header
client.println("Content-Type: text/xml");
client.println("Connection: keep-alive");
client.println(); // send XML file containing input states
XML_response(client);
}
else { // web page request
// send rest of HTTP header
client.println("Content-Type: text/html");
client.println("Connection: keep-alive");
client.println();
// send web page
webFile = SD.open("index.htm"); // open web page file
if (webFile) {
while(webFile.available()) {
client.write(webFile.read()); // send web page to client
}
webFile.close();
}
}
// display received HTTP request on serial port
Serial.print(HTTP_req);
// reset buffer index and all buffer elements to 0
req_index = 0;
StrClear(HTTP_req, REQ_BUF_SZ);
break;
}
// every line of text received from the client ends with \r\n
if (c == '\n') {
// last character on line of received text
// starting new line with next character read
currentLineIsBlank = true;
}
else if (c != '\r') {
// a text character was received from client
currentLineIsBlank = false;
}
} // end if (client.available())
} // end while (client.connected())
delay(1); // give the web browser time to receive the data
client.stop(); // close the connection
} // end if (client)
}// send the XML file containing analog value
void XML_response(EthernetClient cl)
{
int analog_val;
      cl.print("<?xml version = \"1.0\" ?>");
      cl.print("<inputs>");
      // read analog pin A2
      analog_val = analogRead(2);
      cl.print("<analog>");
      cl.print(analog_val);
      cl.print("</analog>");
      cl.print("</inputs>");
  }
// sets every element of str to 0 (clears array)
void StrClear(char *str, char length)
{
for (int i = 0; i < length; i++) {
str[i] = 0;
}
}
// searches for the string sfind in the string str
// returns 1 if string found
// returns 0 if string not found
char StrContains(char *str, char *sfind)
{
    char found = 0;
    char index = 0;
    char len;
    len = strlen(str);
    if (strlen(sfind) > len) {
        return 0;
    }
    while (index < len) {
        if (str[index] == sfind[found]) {
            found++;
            if (strlen(sfind) == found) {
                return 1;
            }
        }
        else {
            found = 0;
        }
        index++;
    }
      return 0;
  }
Hi, i wonder if any one experiencing the same, but in my thing sepak profiel i can only see : 1- User API Key 2- Alert API Key
but no MQTT API key? not sure why Thank you
Hallo,
bei THINKSPEAK werden auf dem Handy max 60 Werte angezeigt.
Bei 1 Wert pro Stunde sieht man also 2,5 Tage.
Ich würde lieber 1 Wert pro Tag senden und damit 60 Tage im Überblick haben.
Gibt es dafür eine Lösung ?
Danke & MfG
Peter Benger
Dear Sir, I have configure the thing-speak account for our monitoring system.But I have two issue regarding this as shown below; 1.whatever the field i have configure in the channel number 1,2...8,with respective tag, same tag is not reflected on graph.i just shown to you for your reference in the attachments. 2 whatever the excel file is generating based on input data it takes 7 minutes of delay.after live capturing. can you please resolve this issue for me