Implement User Interface Using Visual Basic Form Controls
Overview
This example illustrates the creation of a comprehensive Excel® application to perform spectral analysis. It requires knowledge of Visual Basic® forms and controls, and Excel workbook events. See the VBA documentation for a complete discussion of these topics.
You create an Excel add-in using functions that perform a fast Fourier transform (FFT) on an input data set and plot the power spectral density. The function returns the FFT results, an array of frequency points, and the power spectral density of the input data. You then create a custom VBA macro with form controls to designate input and output ranges in the current worksheet. Invoke the spectral analysis application from the Excel Tools menu.
To create the add-in:
Build an Excel add-in from MATLAB® code.
Implement the necessary VBA code to collect input and dispatch the calls to your component. This code also creates a menu item for the application in Excel.
Create the UI using form controls.
Save the finished Excel add-in and package all necessary components for application deployment.
Before creating Excel add-ins, verify that you have met all of the MATLAB Compiler™ Excel target requirements. For details, see Excel Target Requirements and Limitations for MATLAB Compiler.
Build Excel Add-In
Make a copy of the
xlspectralfolder that ships with MATLAB.copyfile(fullfile(matlabroot,'toolbox','matlabxl','examples','xlspectral'))
Examine the MATLAB functions
computefft.mandplotfft.m.Build the Excel add--in with the Excel Add-in Compiler app or
compiler.build.excelAddIn.Use the following information for your project:
Add-in Name FourierClass Name FourierFile to compile plotfft.mNote
In this example, the application that uses the
fourierclass does not callcomputefftdirectly. Thecomputefftmethod is required only by theplotfftmethod. Thus, you do not need to manually add thecomputefftfunction to the package, as the compiler automatically includes it during dependency analysis.For example, if you are using
compiler.build.excelAddIn, type:buildResults = compiler.build.excelAddIn('plotfft.m',... 'AddInName','Fourier',... 'ClassName','Fourier',... 'GenerateVisualBasicFile','on',... 'Verbose','on');
Your component has one class with two methods:
computefft— Computes the FFT and power spectral density of the input data, and computes a vector of frequency points based on the length of the data entered and the sampling interval.plotfft— Performs the same operations ascomputefft, and also plots the input data and the power spectral density in a MATLAB figure window.
Implement VBA code
Having built your component, implement the necessary VBA code to integrate it into Excel.
Note
The shipped Excel add-in Fourier.xla in the
xlspectral folder already contains the following VBA code. To
use the shipped add-in, open it in Excel, add references to Fourier 1.0 Type
Library and MWComUtil
X.X Type Library in the Excel
Visual Basic Editor, and save the add-in. You can then skip to Test the Add-In.
Start Excel.
Open your generated Excel add-in.
From the Developer tab, click Visual Basic, or press ALT+F11 to open the Visual Basic Editor. In older versions of Excel, it may be located under Tools > Macro > Visual Basic Editor.
In the Visual Basic Editor, select Tools > References to open the Project References dialog box.
Select the Fourier 1.0 Type Library entry that corresponds to your generated Excel add-in and MWComUtil
X.XType Library that corresponds to your version of MATLAB or MATLAB Runtime. Click OK to add the references.
Create Main VB Code Module
The add-in requires initialization code and global variables to hold the application state between function invocations. Implement a Visual Basic code module to manage these tasks.
If there is not already a module present under Modules, right-click the VBAProject item in the project window and select Insert > Module.
A new module appears under Modules in the VBA Project.
In the module property page, change the
Nameproperty fromModule1toFourierMain. You may need to show the property window by pressing F4.Enter the following code in the
FourierMainmodule and close the code window.' ' FourierMain - Main module stores global state of controls ' and provides initialization code ' Public theFourier As Fourier.Fourier 'Global instance of Fourier object Public theFFTData As MWComplex 'Global instance of MWComplex to accept FFT Public InputData As Range 'Input data range Public Interval As Double 'Sampling interval Public Frequency As Range 'Output frequency data range Public PowerSpect As Range 'Output power spectral density range Public bPlot As Boolean 'Holds the state of plot flag Public theUtil As MWUtil 'Global instance of MWUtil object Public bInitialized As Boolean 'Module-is-initialized flag Private Sub LoadFourier() 'Initializes globals and Loads the Spectral Analysis form Dim MainForm As frmFourier On Error GoTo Handle_Error Call InitApp Set MainForm = New frmFourier Call MainForm.Show Exit Sub Handle_Error: MsgBox (Err.Description) End Sub Private Sub InitApp() 'Initializes classes and libraries. Executes once 'for a given session of Excel If bInitialized Then Exit Sub On Error GoTo Handle_Error If theUtil Is Nothing Then Set theUtil = New MWUtil Call theUtil.MWInitApplication(Application) End If If theFourier Is Nothing Then Set theFourier = New Fourier.Fourier End If If theFFTData Is Nothing Then Set theFFTData = New MWComplex End If bInitialized = True Exit Sub Handle_Error: MsgBox (Err.Description) End Sub
Create Visual Basic Form
Develop a user interface for your add-in using the Visual Basic Editor.
Right-click VBAProject in the VBA project window and select Insert and then UserForm.
A new form appears under
Formsin the VBA project window.In the form property page, set the
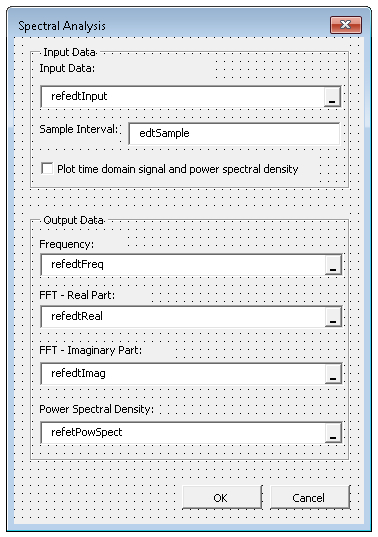
Nameproperty tofrmFourierand theCaptionproperty toSpectral Analysis.Add the following controls to the blank form:
Controls for Spectral Analysis
Control Type Control Name Properties Purpose CheckBoxchkPlotCaption =
Plot time domain signal and
                                                power spectral density
Plot input data and power spectral density.
CommandButtonbtnOKCaption =
OKDefault = True
Execute the function and close the dialog box.
CommandButtonbtnCancelCaption =
CancelCancel = True
Dismiss the dialog box without executing the function.
FrameFrame1Caption =
Input
                                        Data
Group all input controls.
FrameFrame2Caption =
Output
                                        Data
Group all output controls.
LabelLabel1Caption =
Input
                                        Data:
Label the
RefEditfor input data.RefEditrefedtInputSelect range for input data.
LabelLabel2Caption =
Sampling
                                            Interval:
Label the
TextBoxfor sampling interval.TextBoxedtSampleSelect sampling interval. LabelLabel3Caption =
Frequency:Label the
RefEditfor frequency output.RefEditrefedtFreqSelect output range for frequency points.
LabelLabel4Caption =
FFT - Real
                                            Part:
Label the
RefEditfor real part of FFT.RefEditrefedtRealSelect output range for real part of FFT of input data.
LabelLabel5Caption =
FFT - Imaginary
                                            Part:
Label the
RefEditfor imaginary part of FFT.RefEditrefedtImagSelect output range for imaginary part of FFT of input data.
LabelLabel6Caption =
 Power Spectral
                                            Density
Label the
RefEditfor power spectral density.RefEditrefedtPowSpectSelect output range for power spectral density of input data.
Your form should look similar to the following image. The text in the boxes is for your reference only.
When the form and controls are complete, right-click the form and select View code.
Enter the following code in the form code window. If you used different names for any of the controls or any global variable, change this code to reflect those differences.
'
'frmFourier Event handlers
'
Private Sub UserForm_Activate()
'UserForm Activate event handler. This function gets called before
'showing the form, and initializes all controls with values stored
'in global variables.
    On Error GoTo Handle_Error
    If theFourier Is Nothing Or theFFTData Is Nothing Then Exit Sub
    'Initialize controls with current state
    If Not InputData Is Nothing Then
        refedtInput.Text = InputData.Address
    End If
    edtSample.Text = Format(Interval)
    If Not Frequency Is Nothing Then
        refedtFreq.Text = Frequency.Address
    End If
    If Not IsEmpty (theFFTData.Real) Then
    If IsObject(theFFTData.Real) And TypeOf theFFTData.Real Is Range Then
            refedtReal.Text = theFFTData.Real.Address
        End If
    End If
    If Not IsEmpty (theFFTData.Imag) Then
    If IsObject(theFFTData.Imag) And TypeOf theFFTData.Imag Is Range Then
            refedtImag.Text = theFFTData.Imag.Address
        End If
    End If
    If Not PowerSpect Is Nothing Then
        refedtPowSpect.Text = PowerSpect.Address
    End If
    chkPlot.Value = bPlot
    Exit Sub
Handle_Error:
    MsgBox (Err.Description)
End Sub

Private Sub btnCancel_Click()
'Cancel button click event handler. Exits form without computing fft
'or updating variables.
    Unload Me
End Sub
Private Sub btnOK_Click()
'OK button click event handler. Updates state of all variables from controls
'and executes the computefft or plotfft method.
    Dim R As Range

    If theFourier Is Nothing Or theFFTData Is Nothing Then GoTo Exit_Form
    On Error Resume Next
    'Process inputs
    Set R = Range(refedtInput.Text)
    If Err <> 0 Then
        MsgBox ("Invalid range entered for Input Data")
        Exit Sub
    End If
    Set InputData = R
    Interval = CDbl(edtSample.Text)
    If Err <> 0 Or Interval <= 0 Then
        MsgBox ("Sampling interval must be greater than zero")
        Exit Sub
    End If
    'Process Outputs
    Set R = Range(refedtFreq.Text)
    If Err = 0 Then
        Set Frequency = R
    End If
    Set R = Range(refedtReal.Text)
    If Err = 0 Then
        theFFTData.Real = R
    End If
    Set R = Range(refedtImag.Text)
    If Err = 0 Then
        theFFTData.Imag = R
    End If
    Set R = Range(refedtPowSpect.Text)
    If Err = 0 Then
        Set PowerSpect = R
    End If
    bPlot = chkPlot.Value
    'Compute the fft and optionally plot power spectral density
    If bPlot Then
        Call theFourier.plotfft(3, theFFTData, Frequency, PowerSpect, _
     InputData, Interval)
    Else
        Call theFourier.computefft(3, theFFTData, Frequency, PowerSpect, _
     InputData, Interval)
    End If
    GoTo Exit_Form
Handle_Error:
    MsgBox (Err.Description)
Exit_Form:
    Unload Me
End Sub
Add Event Handlers to Workbook
Right-click the ThisWorkbook item in the VBA project window and select View code.
Place the following code into
ThisWorkbook.Private Sub Workbook_AddinInstall() 'Called when Addin is installed Call AddFourierMenuItem End Sub Private Sub Workbook_AddinUninstall() 'Called when Addin is uninstalled Call RemoveFourierMenuItem End Sub Private Sub AddFourierMenuItem() Dim ToolsMenu As CommandBarPopup Dim NewMenuItem As CommandBarButton 'Remove if already exists Call RemoveFourierMenuItem 'Find Tools menu Set ToolsMenu = Application.CommandBars(1).FindControl(ID:=30007) If ToolsMenu Is Nothing Then Exit Sub 'Add Spectral Analysis menu item Set NewMenuItem = ToolsMenu.Controls.Add(Type:=msoControlButton) NewMenuItem.Caption = "Spectral Analysis..." NewMenuItem.OnAction = "LoadFourier" End Sub Private Sub RemoveFourierMenuItem() Dim CmdBar As CommandBar Dim Ctrl As CommandBarControl On Error Resume Next 'Find tools menu and remove Spectral Analysis menu item Set CmdBar = Application.CommandBars(1) Set Ctrl = CmdBar.FindControl(ID:=30007) Call Ctrl.Controls("Spectral Analysis...").Delete End SubThe code adds event handlers for the workbook events
AddinInstallandAddinUninstallthat install and uninstall menu items. The menu item calls theLoadFourierfunction in theFourierMainmodule.When you are finished, click the save icon or press CTRL + S to save the add-in.
Test the Add-In
Before distributing the add-in, test it with a sample problem. Spectral analysis is commonly used to find the frequency components of a signal buried in a noisy time domain signal. Create a data representation of a signal containing two distinct components and add to it a random component. This data, along with the output, is stored in columns of an Excel worksheet, and you plot the time-domain signal along with the power spectral density.
Create Test Problem
Start a new session of Excel with a blank workbook.
From the Developer tab, select Excel Add-Ins.
In the Add-Ins dialog box, click Browse.
Browse to
Fourier.xlaand click OK.The Spectral Analysis add-in appears in the available Add-Ins list with a checked box.
Click OK to load the add-in.
This add-in installs a menu item under the Excel Add-ins menu.
Create Data
Before invoking the add-in, create test data that contains a signal with components at 15 Hz and 40 Hz. Sample the signal for 10 seconds at a sampling rate of 0.01 s. Put the time points into column A and the signal points into column B.
Enter
0into cell A1 in the current worksheet.Press F5 or CTRL+G to launch the Go To dialog. Add the reference A2:A1001 and click OK to select the cells.
Enter the formula
= A1 + 0.01, then press CTRL+Enter to apply the formula to the selected cells.This procedure fills the range A1:A1001 with the interval 0–10 incremented by 0.01.
Repeat the Go To procedure to enter the following formula into each cell in the range B1:B1001:
= SIN(2*PI()*15*A1) + SIN(2*PI()*40*A1) + RAND()
Run Test
Using the column of data (column B), test the add-in.
To display the Spectral Analysis UI, select Add-ins > Spectral Analysis.
Click the Input Data box.
Select the
B1:B1001range from the worksheet, or type this range into the Input Data field.In the Sampling Interval field, type
0.01.Select Plot time domain signal and power spectral density.
Enter
C1:C1001for frequency output, and likewise enterD1:D1001,E1:E1001, andF1:F1001for the FFT real part, FFT imaginary part, and spectral density.Click OK to run the analysis.
The following figure shows an example of the output.
The power spectral density reveals the two signals at 15 Hz and 40 Hz.
See Also
Excel Add-in
Compiler | compiler.build.excelAddIn