Profile Deep Learning Network for Deployment
This example shows how to profile a deep learning network in Simulink. Profiling your network before training is a good way of checking that the network meets your requirements, before spending time on training. This example shows how to check:
Number of learnable parameters
Network size and potential reduction using compression methods
Simulation speed
SIL stack usage
Build Network
To build a network, use the Deep Network Designer app.
deepNetworkDesigner
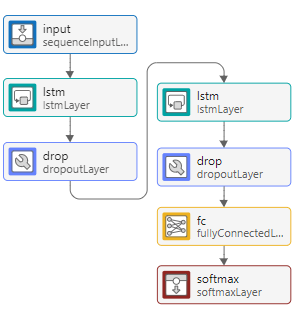
From the start page, in the Sequence-to-Sequence Classification Networks (Untrained) section, select LSTM.
To make the network deeper, drag and select the lstmLayer and dropoutLayer.

To copy the layers, click Duplicate. Alternatively, press Ctrl+C then Ctrl+V to copy and paste the layers. Connect the new layers after the first dropoutLayer.
Analyze Network
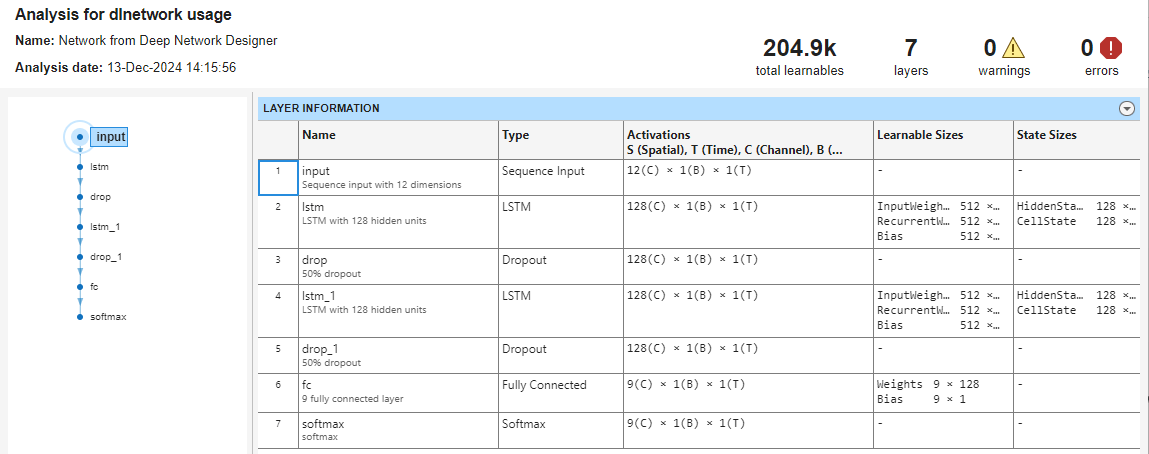
To analyze the network for any issues and see the size of the learnable parameters, click Analyze. The Network Analyzer report displays the size of the activations for each layer. The Network Analyzer report provides an initial check of the size of your network.
(Optional) Analyze Network Compressibility
You can also use the Deep Network Designer app to analyze your network for memory reduction using compression techniques. Click Analyze for Compression. This feature requires Deep Learning Toolbox™ Model Compression Library. The compression analysis report shows information about:
Maximum possible reduction of memory on disk
Pruning, projection, and quantization support
Effect of the network architecture on the ability to prune individual layers
Layer memory
For this network, the reports shows that you can apply projection and quantization techniques to reduce the size of the network.
For an example showing how to compress your network for deep learning tasks, see Analyze and Compress 1-D Convolutional Neural Network. For more information about different compression techniques, see Reduce Memory Footprint of Deep Neural Networks.

Export Network to Simulink
Training a deep neural network often takes a long time. It is useful to check that your network meets your requirements before spending time on training.
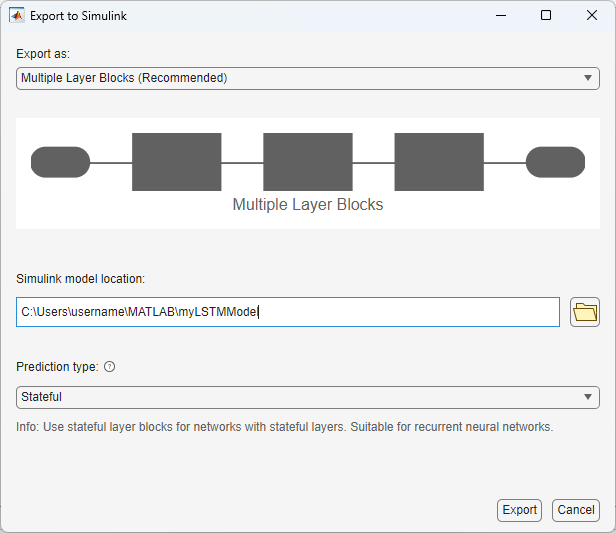
To export the untrained network to Simulink, click Export > Export to Simulink. The Export to Simulink dialog selects the best export type for your network. For this network, layer blocks are recommended. Layer blocks represent each layer in the network as a Simulink block. If any blocks were not supported as layer blocks, the app shows a warning. You can also profile a network using network blocks, for example, the Predict block. Keep the default settings and click Export.
During export, the app initializes the network. Initialization is the process of setting the initial values for the learnable parameters and states of the network. As such, the size of the initialized network is the same as the size of the trained network. You can therefore run checks on the untrained network, such as assess if the execution time and size is suitable for your deployment target.
The app opens Simulink with the exported network.
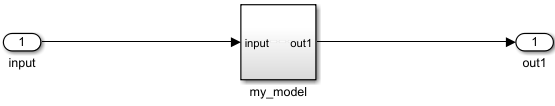
Click inside the subsystem to see the layer blocks. You can see that each layer is represented by a Simulink block.

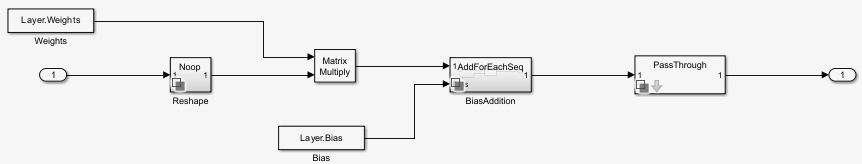
For each layer, you can click inside to see the operations of the layer. For example, on the Fully Connected block, click the arrow to look under the mask.
Analyze Inference Speed
Simulink Profiler allows you to examine the model and block execution and to identify issues that can contribute to poor simulation performance. This process lets you see which of the layer blocks are the slowest in terms of simulation speed.
Start Simulink Profiler:
On the Debug tab, select Performance > Simulink Profiler.
Set Stop Time to 200.
On the Profiler tab, click Profile.
When the simulation is complete, the Profiler Report pane opens and displays the simulation profile for the model. In the Path column, expand my_model. The pane lists the performance times of the layer blocks in descending order, from slowest to fastest.
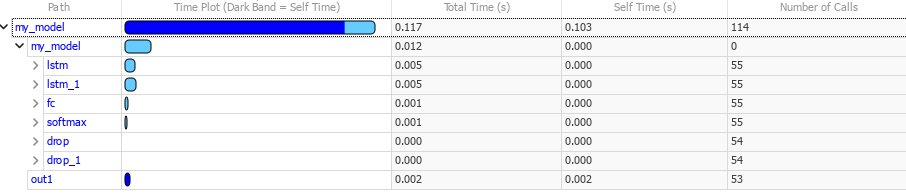
In this network, most of the inference time is spent within the two LSTM layers.
Analyze SIL Stack Usage
A SIL simulation generates source code from the model, compiles and builds the source code, and executes an application as a separate process on your host computer. During a SIL simulation, you can collect code coverage and execution-time metrics for the generated code.
Note: This example only shows how to perform SIL testing. To analyze the inference time and runtime memory for your target hardware, perform PIL testing. You can also perform SIL and PIL profiling without hardware using QEMU. For more information, see Hardware Implementation Pane: ARM Cortex-A9 Hardware Boards and QEMU (Embedded Coder).
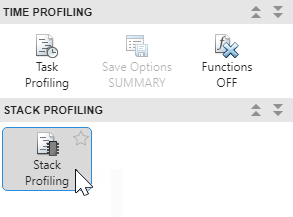
On the Apps tab, click SIL/PIL Manager. In the SIL/PIL tab, click Settings and select Stack Profiling. Click Run Verification.
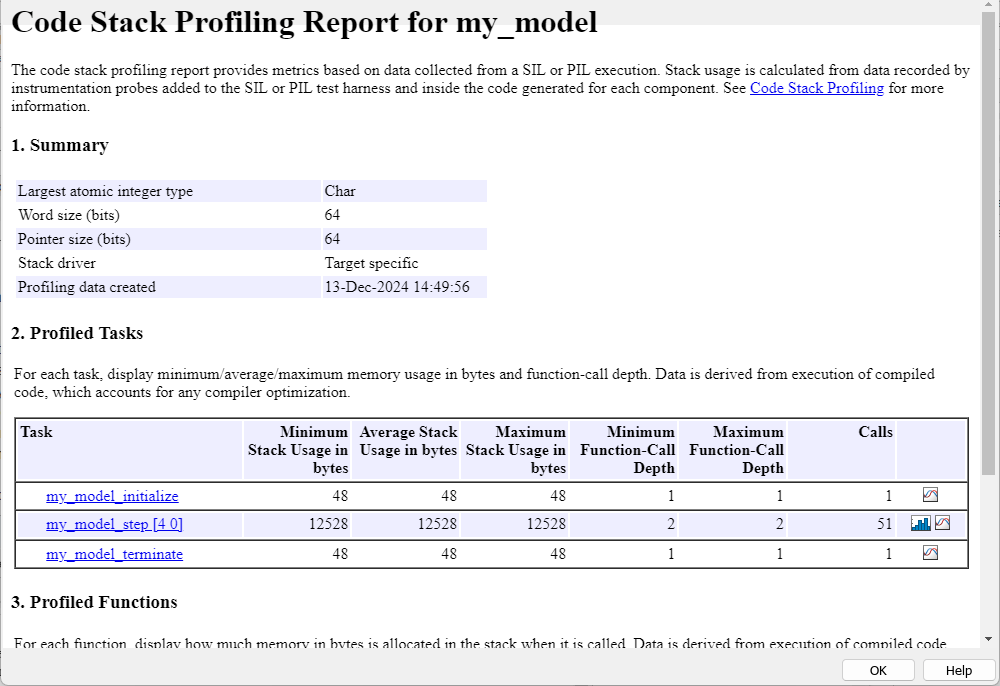
The SIL simulation streams stack usage data to the Simulation Data Inspector. When the simulation is complete, the SIL/PIL Manager opens a code stack profiling report for the model. For each code section, the table provides this information:
Minimum Usage — Minimum stack memory usage in bytes.
Average Usage — Average stack memory usage in bytes
Maximum Usage — Maximum stack memory usage in bytes
Minimum Function-Call Depth — Minimum number of nested function calls.
Maximum Function-Call Depth — Maximum number of nested function calls.
Calls — Number of times that the generated code section is called.
You can use this information to assess the stack usage data for your network. Profiling the stack size is important for deep learning applications where it is possible for the peak activation size of the network to be more than the memory available on the target hardware. If your application is constrained by limited memory, then you can specify the maximum allowable stack size to control the number of local and global variables in the generated code. For more information, see Customize Stack Space Allocation (Simulink Coder).
See Also
Deep Network Designer | Simulink Profiler (Simulink) | SIL/PIL Manager (Embedded Coder)