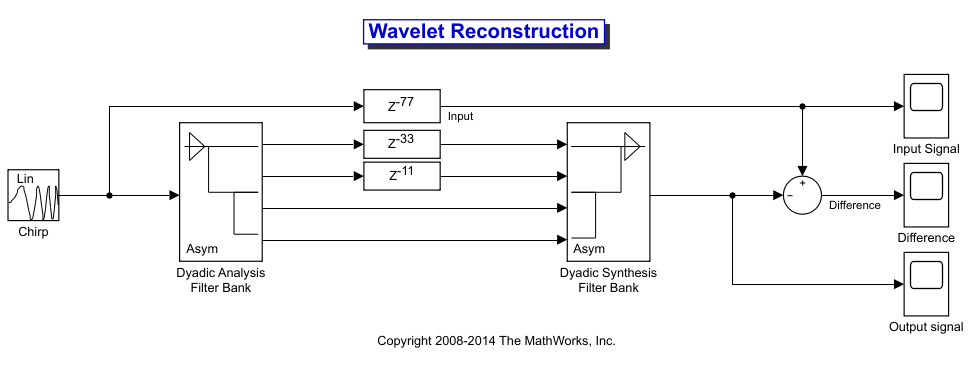
Calculate Channel Latencies Required for Wavelet Reconstruction
Analyze Your Model
The following sections guide you through the process of calculating the channel latencies required for perfect wavelet reconstruction. This example uses the ex_wavelets model, but you can apply the process to perform perfect wavelet reconstruction in any model.
Note: You must have a Wavelet Toolbox™ product license to run the ex_wavelets model.

Before you can begin calculating the latencies required for perfect wavelet reconstruction, you must know the types of filters being used in your model.
The Dyadic Analysis Filter Bank and the Dyadic Synthesis Filter Bank blocks in the ex_wavelets model have the following settings:
Filter =
BiorthogonalFilter order [synthesis/analysis] =
[3/5]Number of levels = 3
Tree structure =
AsymmetricInput =
Multiple ports
Based on these settings, the Dyadic Analysis Filter Bank and the Dyadic Synthesis Filter Bank blocks construct biorthogonal filters using the Wavelet Toolbox wfilters function.
Calculate the Group Delay of Your Filters
Once you know the types of filters being used by the Dyadic Analysis and Dyadic Synthesis Filter Bank blocks, you need to calculate the group delay of those filters. To do so, you can use the Signal Processing Toolbox™ FVTool.
Before you can use fvtool, you must first reconstruct the
filters in the MATLAB® workspace. To do so, type the following code at the MATLAB command line:
[Lo_D, Hi_D, Lo_R, Hi_R] = wfilters('bior3.5')
Where Lo_D and Hi_D represent the low- and
high-pass filters used by the Dyadic Analysis Filter Bank block, and
Lo_R and Hi_R represent the low- and
high-pass filters used by the Dyadic Synthesis Filter Bank block.
After you construct the filters in the MATLAB workspace, you can use fvtool to determine the
group delay of the filters. To analyze the low-pass biorthogonal filter used by the
Dyadic Analysis Filter Bank block, you must do the following:
Type
fvtool(Lo_D)at the MATLAB command line to launch the Filter Visualization Tool.When the Filter Visualization Tool opens, click the Group delay response button (
 ) on the toolbar, or select
Group Delay Response from the
Analysis menu.
Based on the Filter Visualization Tool's analysis, you can see that the group delay of the Dyadic Analysis Filter Bank block's low-pass biorthogonal filter is 5.5.

Note
Repeat this procedure to analyze the group delay of each of the filters in
your model. This section does not show the results for each filter in the
ex_wavelets model because all wavelet filters in this
particular example have the same group delay.
Reconstruct the Filter Bank System
To determine the delay introduced by the analysis and synthesis filter bank system, you must reconstruct the tree structures of the Dyadic Analysis Filter Bank and the Dyadic Synthesis Filter Bank blocks. To learn more about constructing tree structures for the Dyadic Analysis Filter Bank and Dyadic Synthesis Filter Bank blocks, see the following sections of the DSP System Toolbox™ User's Guide:
Because the filter blocks in the ex_wavelets model use
biorthogonal filters with three levels and an asymmetric tree structure, the filter
bank system appears as shown in the following figure.

The extra delay values of M and N on paths 3 and 4 in the previous figure ensure that the total delay on each of the four filter paths is identical.
Equalize the Delay on Each Filter Path
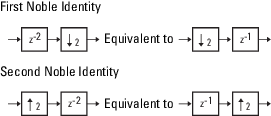
Now that you have reconstructed the filter bank system, you can calculate the delay on each filter path. To do so, use the following Noble identities:

You can apply the Noble identities by summing the delay on each signal path from right to left. The first Noble identity indicates that moving a delay of 1 before a downsample of 2 is equivalent to multiplying that delay value by 2. Similarly, the second Noble identity indicates that moving a delay of 2 before an upsample of 2 is equivalent to dividing that delay value by 2.
The fvtool analysis in step 1 found that both the low- and
high-pass filters of the analysis filter bank have the same group delay
(F0 =
F1 = 5.5). Thus, you can use
F to represent the group delay of the analysis filter bank.
Similarly, the group delay of the low- and high-pass filters of the synthesis filter
bank is the same
(G0=G1=5.5),
so you can use G to represent the group delay of the synthesis
filter bank.
The following figure shows the filter bank system with the intermediate delay sums displayed below each path.

You can see from the previous figure that the signal delays on paths 1 and 2 are identical: 7(F+G). Because each path of the filter bank system has identical delay, you can equate the delay equations for paths 3 and 4 with the delay equation for paths 1 and 2. After constructing these equations, you can solve for M and N, respectively:
The fvtool analysis in step 1 found the group delay of each
biorthogonal wavelet filter in this model to be 5.5 samples. Therefore, F = 5.5 and G = 5.5. By inserting these values into the two previous equations, you
get M = 11 and N = 33. Because the total delay on each filter path must be the same, you
can find the overall delay of the filter bank system by inserting F = 5.5 and G = 5.5 into the delay equation for any of the four filter paths.
Inserting the values of F and G into
7(F+G) yields an overall delay of 77
samples for the filter bank system of the ex_wavelets
model.
Update and Run the Model
Now that you know the latencies required for perfect wavelet reconstruction, you
can incorporate those delay values into the model. The
ex_wavelets model has already been updated with the
correct delay values (M = 11, N = 33,
Overall = 77), so it is ready to run.

After you run the model, examine the reconstruction error in the Difference scope. To further examine any particular areas of interest, use the zoom tools available on the toolbar of the scope window or from the View menu.

References
[1] Strang, G. and Nguyen, T. Wavelets and Filter Banks. Wellesley, MA: Wellesley-Cambridge Press, 1996.