Identificazione di modelli lineari utilizzando la riga di comando
Introduzione
Obiettivi
Stimare e convalidare modelli lineari da dati a ingresso multiplo/uscita singola (MISO) per trovare quello che descrive meglio la dinamica del sistema.
Dopo aver completato questo tutorial, si sarà in grado di eseguire le seguenti attività utilizzando la riga di comando:
Creare oggetti dati per rappresentare i dati.
Tracciare i dati.
Elaborare i dati rimuovendo gli offset dai segnali in ingresso e in uscita.
Stimare e convalidare modelli lineari dai dati.
Simulare e prevedere l’uscita del modello.
Nota
Questo tutorial utilizza i dati nel dominio del tempo per dimostrare come sia possibile stimare i modelli lineari. Lo stesso workflow si applica all’adattamento dei dati nel dominio della frequenza.
Descrizione dei dati
Questo tutorial utilizza il file di dati co2data.mat, che contiene due esperimenti di dati nel dominio del tempo a doppio ingresso e uscita singola (MISO) da uno stato stazionario, che l’operatore ha perturbato con valori di equilibrio.
Nel primo esperimento, l’operatore ha introdotto un’onda di impulso in entrambi gli ingressi. Nel secondo esperimento, l’operatore ha introdotto un’onda di impulso nel primo ingresso e un segnale a gradino nel secondo ingresso.

Preparazione dei dati
Caricamento dei dati nell’area di lavoro MATLAB
Caricare i dati.
load co2data
Questo comando carica le seguenti cinque variabili nell'area di lavoro MATLAB:
Input_exp1eOutput_exp1sono rispettivamente i dati in ingresso e in uscita del primo esperimento.Input_exp2eOutput_exp2sono rispettivamente i dati in ingresso e in uscita del secondo esperimento.Timeè il vettore del tempo da 0 a 1000 minuti che aumenta con incrementi uguali di0.5min.
Per entrambi gli esperimenti, i dati in ingresso consistono di due colonne di valori. La prima colonna di valori è la velocità di consumo chimico (espressa in chilogrammi al minuto), mentre la seconda colonna di valori è la corrente (espressa in ampere). I dati in uscita della velocità di produzione di anidride carbonica (espressa in milligrammi al minuto) sono in una colonna singola.
Plottaggio dei dati in ingresso/in uscita
Tracciare i dati in ingresso e in uscita di entrambi gli esperimenti.
plot(Time,Input_exp1,Time,Output_exp1)
legend('Input 1','Input 2','Output 1')
figure
plot(Time,Input_exp2,Time,Output_exp2)
legend('Input 1','Input 2','Output 1')
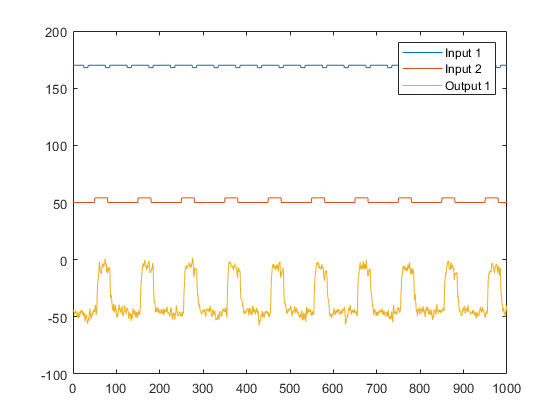
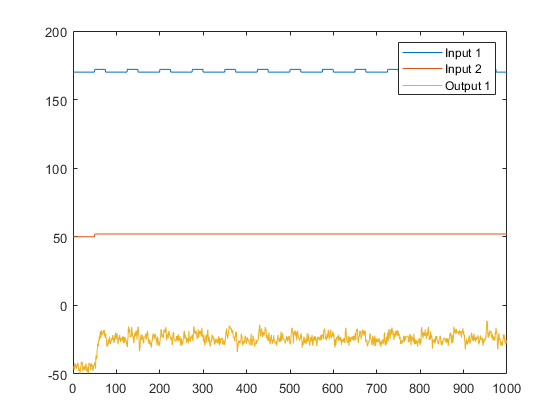
Il primo grafico mostra il primo esperimento, in cui l’operatore applica un’onda di impulso in ciascun ingresso per perturbarlo dallo stato stazionario di equilibrio.
Il secondo grafico mostra il secondo esperimento, in cui l’operatore applica un’onda di impulso nel primo ingresso e un segnale a gradino nel secondo ingresso.
Rimozione dei valori di equilibrio dai dati
Il plottaggio dei dati come descritto in Plottaggio dei dati in ingresso/in uscita, mostra che gli ingressi e le uscite hanno valori di equilibrio diversi da zero. In questa sezione del tutorial, si sottraggono i valori di equilibrio dai dati.
Il motivo per cui si sottraggono i valori medi da ciascun segnale è dovuto al fatto che, usualmente, si costruiscono modelli lineari che descrivono le risposte per le deviazioni da un equilibrio fisico. Con dati allo stato stazionario, è ragionevole presumere che i livelli medi dei segnali corrispondano a tale equilibrio. Pertanto, è possibile cercare modelli intorno allo zero senza modellare i livelli di equilibrio assoluto in unità fisiche.
Ingrandendo i grafici è possibile vedere che il primo momento in cui l’operatore applica un disturbo agli ingressi si verifica dopo 25 minuti di condizioni allo stato stazionario (o dopo i primi 50 campioni). Pertanto, il valore medio dei primi 50 campioni rappresenta le condizioni di equilibrio.
Utilizzare i seguenti comandi per rimuovere i valori di equilibrio dagli ingressi e dalle uscite in entrambi gli esperimenti:
Input_exp1 = Input_exp1-...
   ones(size(Input_exp1,1),1)*mean(Input_exp1(1:50,:));
Output_exp1 = Output_exp1-...
   mean(Output_exp1(1:50,:));
Input_exp2 = Input_exp2-...
   ones(size(Input_exp2,1),1)*mean(Input_exp2(1:50,:));
Output_exp2 = Output_exp2-...
   mean(Output_exp2(1:50,:));
Utilizzo degli oggetti per rappresentare i dati per System Identification
Gli oggetti dati System Identification Toolbox™, iddata e idfrd, incapsulano i valori dei dati e le proprietà dei dati come entità singole. È possibile utilizzare i comandi System Identification Toolbox per manipolare questi oggetti dati in modo conveniente come entità singole.
In questa sezione del tutorial, si creano due oggetti iddata, uno per ciascuno dei due esperimenti. Si utilizzano i dati dell’esperimento 1 per la stima del modello e i dati dell’esperimento 2 per la validazione del modello. Si lavora con due insiemi di dati indipendenti poiché si utilizza un insieme di dati per la stima del modello e l’altro insieme per la validazione del modello.
Nota
Quando due insiemi di dati indipendenti non sono disponibili, è possibile dividere un insieme in due parti, assumendo che ciascuna parte contenga informazioni sufficienti per rappresentare adeguatamente la dinamica del sistema.
Creazione di oggetti iddata
È necessario che i dati di campionamento siano già caricati nell’area di lavoro MATLAB®, come descritto in Caricamento dei dati nell’area di lavoro MATLAB.
Utilizzare questi comandi per creare due oggetti dati ze e zv:
Ts = 0.5; % Sample time is 0.5 min
ze = iddata(Output_exp1,Input_exp1,Ts);
zv = iddata(Output_exp2,Input_exp2,Ts);
ze contiene i dati dell’esperimento 1 e zv contiene i dati dell’esperimento 2. Ts è il tempo di campionamento.
Il costruttore iddata richiede tre argomenti per i dati nel dominio del tempo e ha la seguente sintassi:
data_obj = iddata(output,input,sampling_interval);
Per visualizzare le proprietà di un oggetto iddata, utilizzare il comando get. Ad esempio, digitare questo comando per ottenere le proprietà dei dati di stima:
Per saperne di più sulle proprietà dell’oggetto dati, vedere la pagina di riferimento iddata.
Per modificare le proprietà dei dati, è possibile utilizzare la notazione col punto o il comando set. Ad esempio, per assegnare i nomi ai canali e alle unità che etichettano gli assi del grafico, digitare la seguente sintassi nella finestra di comando MATLAB:
Suggerimento
I nomi delle proprietà, come InputUnit, non fanno distinzione tra lettere maiuscole e lettere minuscole. È inoltre possibile abbreviare i nomi delle proprietà che iniziano con Input o Output sostituendo u per Input e y per Output nel nome della proprietà. Ad esempio, OutputUnit equivale a yunit.
Plottaggio dei dati in un oggetto dati
È possibile tracciare oggetti iddata utilizzando il comando plot.
Tracciare i dati di stima.
plot(ze)
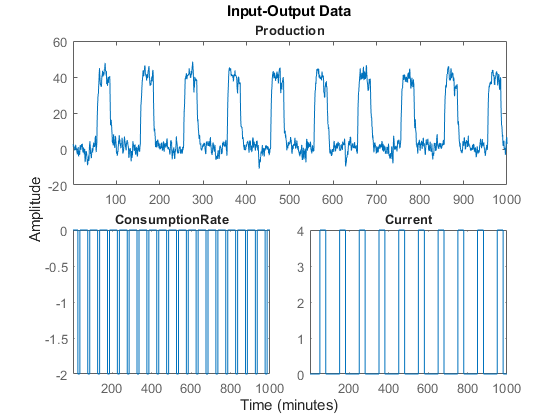
Gli assi inferiori mostrano gli ingressi ConsumptionRate e Current, mentre gli assi superiori mostrano l'uscita ProductionRate.
Selezione di un sottoinsieme di dati
Prima di iniziare, creare un nuovo insieme di dati che contenga solo i primi 1000 campioni degli insiemi originali di dati di stima e di validazione onde velocizzare i calcoli.
Ze1 = ze(1:1000);
Zv1 = zv(1:1000);
Per ulteriori informazioni sull’indicizzazione in oggetti iddata, vedere la pagina di riferimento corrispondente.
Stima dei modelli di risposta impulsiva
Perché stimare i modelli di risposta al gradino e di risposta in frequenza?
La risposta in frequenza e la risposta al gradino sono modelli non parametrici che possono aiutare a comprendere le caratteristiche dinamiche del sistema. Questi modelli non sono rappresentati da una formula matematica compatta con parametri regolabili ma sono costituiti da tabelle di dati.
In questa sezione del tutorial, si stimano questi modelli utilizzando l’insieme di dati ze. È necessario che ze sia già stato creato, come descritto in Creazione di oggetti iddata.
I grafici di risposta di questi modelli mostrano le seguenti caratteristiche del sistema:
La risposta dal primo ingresso all’uscita potrebbe essere una funzione del secondo ordine.
La risposta dal secondo ingresso all’uscita potrebbe essere una funzione del primo ordine o una funzione sovrasmorzata.
Stima della risposta in frequenza
Il prodotto System Identification Toolbox fornisce tre funzioni per la stima della risposta in frequenza:
etfecalcola la funzione di trasferimento empirico utilizzando l’analisi di Fourier.spastima la funzione di trasferimento utilizzano l’analisi spettrale per una risoluzione in frequenza fissa.spafdrconsente di specificare una risoluzione in frequenza variabile per la stima della risposta in frequenza.
Utilizzare spa per stimare la risposta in frequenza.
Ge = spa(ze);
Tracciare la risposta in frequenza come un grafico di Bode.
bode(Ge)
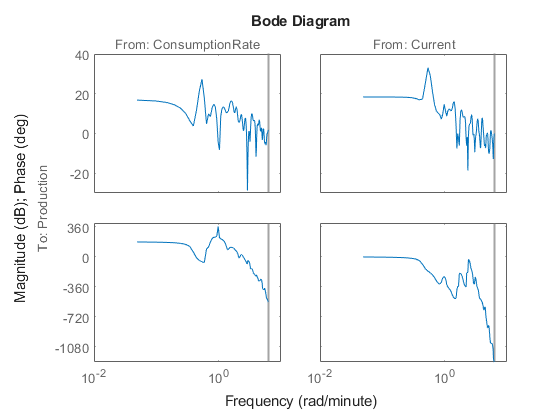
L’ampiezza raggiunge il picco alla frequenza di 0,54 rad/min che suggerisce un possibile comportamento risonante (poli complessi) per la prima combinazione da ingresso-a uscita: da ConsumptionRate a Production.
In entrambi i grafici, la fase si riduce rapidamente suggerendo un ritardo di tempo per entrambe le combinazioni in ingresso/in uscita.
Stima della risposta al gradino empirica
Per stimare la risposta al gradino dai dati, stimare innanzitutto un modello di risposta impulsiva non parametrico (filtro FIR) dai dati, quindi tracciare la relativa risposta al gradino.
% model estimation
Mimp = impulseest(Ze1,60);

% step response
step(Mimp)
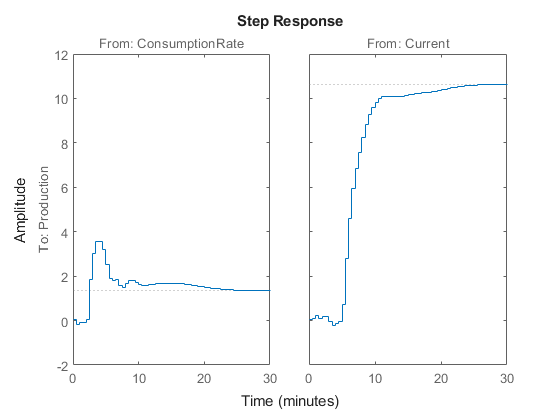
La risposta al gradino della prima combinazione in ingresso/in uscita suggerisce una sovraelongazione, ad indicare la presenza di una modalità sottosmorzata (poli complessi) nel sistema fisico.
La risposta al gradino dal secondo ingresso all’uscita non mostra alcuna sovraelongazione, ad indicare una risposta del primo ordine o una risposta di ordine superiore con poli reali (risposta sovrasmorzata).
Il grafico della risposta al gradino indica un ritardo nel sistema diverso da zero, che è coerente con la rapida riduzione di fase ottenuta nel grafico di Bode creato in Stima della risposta al gradino empirica.
Stima dei ritardi nel sistema a ingresso multiplo
Perché stimare i ritardi?
Per identificare i modelli black-box parametrici, è necessario specificare il ritardo in ingresso/in uscita come parte dell’ordine del modello.
Se i ritardi in ingresso/in uscita del sistema non sono noti dall’esperimento, è possibile utilizzare il software System Identification Toolbox per stimare il ritardo.
Stima dei ritardi utilizzando la struttura del modello ARX
Nel caso di sistemi a ingresso singolo, è possibile leggere il ritardo sul grafico risposta-impulso. Tuttavia, nel caso di sistemi a ingresso multiplo, come quello presentato in questo tutorial, potrebbe non essere possibile identificare quale ingresso ha causato la modifica iniziale nell’uscita; in questo caso è possibile utilizzare il comando delayest.
Il comando stima il ritardo di tempo in un sistema dinamico stimando un modello ARX a tempo discreto di ordine basso con un intervallo di ritardi, dal quale poi scegliere il ritardo che corrisponde al miglior adattamento.
La struttura del modello ARX è una delle strutture parametriche black-box più semplici. Nel tempo discreto, la struttura ARX è un’equazione alle differenze con la seguente forma:
y(t) rappresenta l’uscita al momento t, u(t) rappresenta l’ingresso al momento t, na è il numero di poli, nb è il numero di parametri b (pari al numero di zeri più 1), nk è il numero di campioni prima che l’ingresso influisca sull’uscita del sistema (chiamato ritardo o tempo morto del modello) ed e(t) è il disturbo del rumore bianco.
delayest assume che na=nb=2, che il rumore e sia bianco o insignificante e stima nk.
Per stimare il ritardo in questo sistema, digitare:
delayest(ze)
ans =

     5    10
Questo risultato include due numeri poiché sono presenti due ingressi: il ritardo stimato per il primo ingresso è di 5 campioni di dati e il ritardo stimato per il secondo ingresso è di 10 campioni di dati. Poiché il tempo di campionamento degli esperimenti è di 0.5 min, ciò corrisponde a un ritardo di 2.5 -min prima che il primo ingresso interferisca sull’uscita e a un ritardo di 5.0 -min prima che il secondo ingresso interferisca sull’uscita.
Stima dei ritardi utilizzando metodi alternativi
Esistono due metodi alternativi per stimare il ritardo nel sistema:
Tracciare il grafico temporale dei dati in ingresso e in uscita e leggere la differenza di tempo tra la prima modifica in ingresso e la prima modifica in uscita. Questo metodo è pratico solo per il sistema a ingresso singolo/uscita singola; nel caso di sistemi a ingresso multiplo, potrebbe non essere possibile identificare quale ingresso ha causato la modifica iniziale nell’uscita.
Tracciare la risposta impulsiva dei dati in un intervallo di confidenza con una deviazione standard di 1. È possibile stimare il ritardo di tempo utilizzando il momento in cui la risposta impulsiva si trova per la prima volta al di fuori dell’intervallo di confidenza.
Stima degli ordini del modello utilizzando una struttura del modello ARX
Perché stimare l’ordine del modello?
L’ordine del modello consiste in uno o più numeri interi che definiscono la complessità del modello. In generale, l’ordine del modello è correlato al numero di poli, al numero di zeri e al ritardo della risposta (tempo in termini di numero di campioni prima che l’uscita risponda all’ingresso). Il significato specifico dell’ordine del modello dipende dalla struttura del modello.
Per calcolare i modelli black-box parametrici, è necessario fornire l’ordine del modello come un ingresso. Se non si conosce l’ordine del sistema, è possibile stimarlo.
Dopo aver completato i passaggi in questa sezione, si ottengono i seguenti risultati:
Per la prima combinazione in ingresso/in uscita: na=2, nb=2 e il ritardo nk=5.
Per la seconda combinazione in ingresso/in uscita: na=1, nb=1 e il ritardo nk=10.
Successivamente, scoprire diverse strutture del modello specificando valori dell’ordine del modello che siano piccole variazioni intorno a questa stima iniziale.
Comandi per la stima dell’ordine del modello
In questa sezione del tutorial, utilizzare struc, arxstruc e selstruc per stimare e paragonare modelli polinomiali semplici (ARX) per un intervallo di ordini e ritardi del modello, nonché selezionare gli ordini migliori in base alla qualità del modello.
L'elenco seguente descrive i risultati dell'utilizzo di ciascun comando:
struccrea una matrice di combinazioni ordine-modello per un intervallo specificato di valori na, nb e nk.arxstrucprende l’uscita dastruc, stima sistematicamente un modello ARX per ciascun ordine del modello e paragona l’uscita del modello con l’uscita misurata.arxstrucrestituisce la funzione di perdita per ciascun modello, che è la somma normalizzata degli errori di previsione al quadrato.selstrucprende l’uscita daarxstruce apre la finestra di Selezione della struttura del modello ARX, simile alla figura seguente, per aiutare a scegliere l’ordine del modello.Utilizzare questo grafico per selezionare il modello più adatto.

L’asse orizzontale è il numero totale di parametri — na + nb.
L’asse verticale, chiamato Unexplained output variance (in %), è la porzione di uscita non spiegata dal modello: l’errore di previsione del modello ARX per il numero di parametri mostrati sull’asse orizzontale.
L’errore di previsione è la somma dei quadrati delle differenze tra l’uscita dei dati di validazione e l’uscita prevista uno step in avanti del modello.
nk è il ritardo.
Nel grafico sono evidenziati tre rettangoli in verde, blu e rosso. Ogni colore indica un tipo migliore di criterio di adattamento, come segue:
Rosso: il miglior adattamento minimizza la somma dei quadrati della differenza tra l’uscita dei dati di validazione e l’uscita del modello. Questo rettangolo indica il miglior adattamento complessivo.
Verde: il miglior adattamento minimizza il criterio MDL di Rissanen.
Blu: il miglior adattamento minimizza il criterio AIC di Akaike.
In questo tutorial, il valore Unexplained output variance (in %) rimane approssimativamente costante per il numero combinato di parametri da 4 a 20. Tale costanza indica che la prestazione del modello non migliora a ordini superiori. Pertanto, i modelli di ordine inferiore potrebbero adattarsi ugualmente bene ai dati.
Nota
Quando si utilizza lo stesso insieme di dati per la stima e la validazione, utilizzare i criteri MDL e AIC per selezionare gli ordini del modello. Questi criteri compensano il sovradattamento risultante dall’utilizzo di troppi parametri. Per ulteriori informazioni su questi criteri, vedere la pagina di riferimento
selstruc.
Ordine del modello per la prima combinazione in ingresso-in uscita
In questo tutorial, sono presenti due ingressi nel sistema e un’uscita e si stimano gli ordini del modello per ciascuna combinazione in ingresso/in uscita in modo indipendente. È possibile stimare i ritardi dai due ingressi contemporaneamente o da un ingresso alla volta.
Per la prima combinazione in ingresso/in uscita, è opportuno provare le seguenti combinazioni di ordini:
na=
2:5nb=
1:5nk=
5
In quanto, i modelli non parametrici che sono stati stimati in Stima dei modelli di risposta impulsiva, mostrano che la risposta per la prima combinazione in ingresso/in uscita potrebbe avere una risposta di secondo ordine. Analogamente, in Stima dei ritardi nel sistema a ingresso multiplo, il ritardo di questa combinazione in ingresso/in uscita è stato stimato in 5.
Per stimare l’ordine del modello per la prima combinazione in ingresso/in uscita:
Utilizzare
strucper creare una matrice di ordini possibili del modello.NN1 = struc(2:5,1:5,5);
Utilizzare
selstrucper calcolare le funzioni di perdita per i modelli ARX con gli ordini inNN1.selstruc(arxstruc(ze(:,:,1),zv(:,:,1),NN1))
Nota
ze(:,:,1)seleziona il primo ingresso nei dati.Questo comando apre la finestra interattiva di Selezione della struttura del modello ARX.

Nota
I criteri MDL di Rissanen e AIC di Akaike producono risultati equivalenti e sono entrambi indicati da un rettangolo blu nel grafico.
Il rettangolo rosso rappresenta il miglior adattamento complessivo che si verifica per na=2, nb=3, and nk=5. La differenza di altezza tra il rettangolo rosso e il rettangolo blu è insignificante. Pertanto, è possibile scegliere la combinazione di parametri che corrisponde all’ordine del modello più basso e al modello più semplice.
Fare clic sul rettangolo blu, quindi fare clic su Select per scegliere quella combinazione di ordini:
na=
2nb=
2nk=
5Per proseguire, premere qualsiasi tasto nella finestra di comando MATLAB.
Ordine del modello per la seconda combinazione in ingresso-in uscita
Per la seconda combinazione in ingresso/in uscita, è opportuno provare le seguenti combinazioni di ordini:
na=
1:3nb=
1:3nk=
10
In quanto, i modelli non parametrici che sono stati stimati in Stima dei modelli di risposta impulsiva, mostrano che la risposta per la seconda combinazione in ingresso/in uscita potrebbe avere una risposta di primo ordine. Analogamente, in Stima dei ritardi nel sistema a ingresso multiplo, il ritardo di questa combinazione in ingresso/in uscita è stato stimato in 10.
Per stimare l’ordine del modello per la seconda combinazione in ingresso/in uscita:
Utilizzare
strucper creare una matrice di ordini possibili del modello.NN2 = struc(1:3,1:3,10);
Utilizzare
selstrucper calcolare le funzioni di perdita per i modelli ARX con gli ordini inNN2.selstruc(arxstruc(ze(:,:,2),zv(:,:,2),NN2))
Questo comando apre la finestra interattiva di Selezione della struttura del modello ARX.

Nota
Il criterio AIC di Akaike e il criterio di miglior adattamento complessivo producono un risultato equivalente. Entrambi sono indicati dallo stesso rettangolo rosso sul grafico.
La differenza di altezza tra tutti i rettangoli è insignificante e tutti questi ordini del modello producono una prestazione simile del modello. Pertanto, è possibile scegliere la combinazione di parametri che corrisponde all’ordine del modello più basso e al modello più semplice.
Fare clic sul rettangolo giallo all’estrema sinistra, quindi fare clic su Select per scegliere l’ordine più basso: na=1, nb=1 e nk=10.
Per proseguire, premere qualsiasi tasto nella finestra di comando MATLAB.
Stima delle funzioni di trasferimento
Specifica della struttura della funzione di trasferimento
In questa sezione del tutorial, si stima una funzione di trasferimento a tempo continuo. È necessario che i dati siano già stati preparati, come descritto in Preparazione dei dati. È possibile utilizzare i seguenti risultati degli ordini del modello stimati per specificare gli ordini del modello:
Per la prima combinazione in ingresso/in uscita, utilizzare:
Due poli, corrispondenti a
na=2nel modello ARX.Ritardo di 5, corrispondente a
nk=5campioni (o a 2,5 minuti) nel modello ARX.
Per la seconda combinazione in ingresso/in uscita, utilizzare:
Un polo, corrispondente a
na=1nel modello ARXRitardo di 10, corrispondente a
nk=10campioni (o a 5 minuti) nel modello ARX.
È possibile stimare una funzione di trasferimento di questi ordini utilizzando il comando tfest. Per la stima, è inoltre possibile scegliere di visualizzare un report di avanzamento impostando l’opzione Display su on nell’insieme di opzioni creato dal comando tfestOptions.
Opt = tfestOptions('Display','on');
Raccogliere gli ordini del modello e i ritardi in variabili da sottoporre a tfest.
np = [2 1];
ioDelay = [2.5 5];
Stimare la funzione di trasferimento.
mtf = tfest(Ze1,np,[],ioDelay,Opt);
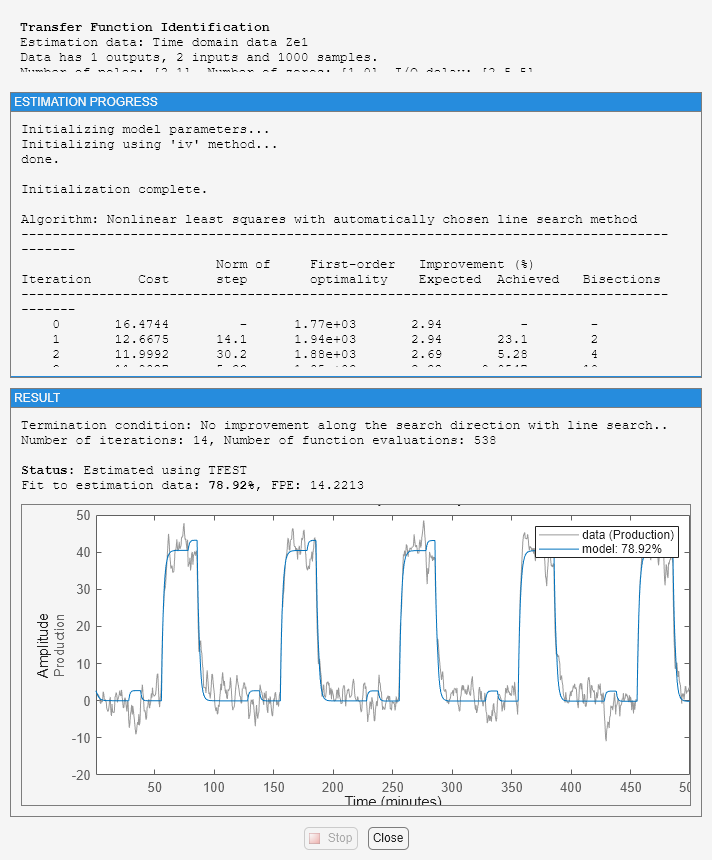
Visualizzare i coefficienti del modello.
mtf
mtf =

  From input "ConsumptionRate" to output "Production":
                  -1.382 s + 0.0008305
  exp(-2.5*s) * -------------------------
                s^2 + 1.014 s + 5.443e-12

  From input "Current" to output "Production":
                 5.93
  exp(-5*s) * ----------
              s + 0.5858

Continuous-time identified transfer function.

Parameterization:
   Number of poles: [2 1]   Number of zeros: [1 0]
   Number of free coefficients: 6
   Use "tfdata", "getpvec", "getcov" for parameters and their uncertainties.

Status:
Estimated using TFEST on time domain data "Ze1".
Fit to estimation data: 78.92%
FPE: 14.22, MSE: 13.97
La visualizzazione del modello mostra un adattamento ai dati di stima superiore all’85%.
Validazione del modello
In questa sezione del tutorial, si crea un grafico che paragona l’uscita effettiva con l’uscita del modello, utilizzando il comando compare.
compare(Zv1,mtf)

Il paragone mostra un adattamento di circa il 60%.
Analisi residua
Utilizzare il comando resid per valutare le caratteristiche dei residui.
resid(Zv1,mtf)
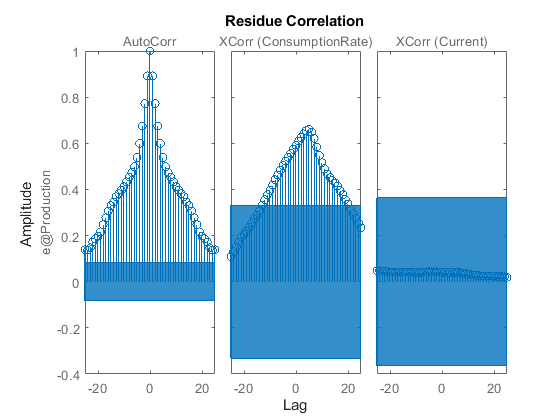
I residui mostrano un elevato grado di autocorrelazione. Non si tratta di un risultato inaspettato poiché il modello mtf non possiede alcuna componente che descriva la natura del rumore separatamente. Per modellare sia la dinamica in ingresso-in uscita misurata sia la dinamica di disturbo, sarà necessario utilizzare una struttura del modello che contenga elementi che descrivano la componente del rumore. È possibile utilizzare i comandi bj, ssest e procest, che creano rispettivamente modelli di strutture polinomiali, nello spazio degli stati e di processo. Queste strutture, tra le altre, contengono elementi per acquisire il comportamento del rumore.
Stima dei modelli di processo
Specifica della struttura del modello di processo
In questa sezione del tutorial, si stima una funzione di trasferimento a tempo continuo di ordine basso (modello di processo). Il prodotto System Identification Toolbox supporta modelli a tempo continuo con al massimo tre poli (che potrebbero contenere poli sottosmorzati), uno zero, un elemento di ritardo e un integratore.
È necessario che i dati siano già stati preparati, come descritto in Preparazione dei dati.
È possibile utilizzare i seguenti risultati degli ordini del modello stimati per specificare gli ordini del modello:
Per la prima combinazione in ingresso/in uscita, utilizzare:
Due poli, corrispondenti a na=2 nel modello ARX.
Un ritardo di 5, corrispondente a nk= 5 campioni (o 2,5 minuti) nel modello ARX.
Per la seconda combinazione in ingresso/in uscita, utilizzare:
Un polo, corrispondente a na=1 nel modello ARX.
Un ritardo di 10, corrispondente a nk= 10 campioni (o 5 minuti) nel modello ARX.
Nota
Poiché non esiste alcuna relazione tra il numero di zeri stimato dal modello ARX a tempo discreto e la sua controparte a tempo continuo, non si dispone di una stima per il numero di zeri. In questo tutorial, è possibile specificare uno zero per la prima combinazione in ingresso/in uscita e nessuno zero per la seconda combinazione in uscita.
Utilizzare il comando idproc per creare due strutture del modello, una per ciascuna combinazione in ingresso/in uscita:
Visualizzazione della struttura del modello e dei valori del parametro
Visualizzare i due modelli risultanti.
midproc0
midproc0 =

Process model with 2 inputs: y = G11(s)u1 + G12(s)u2
  From input 1 to output 1:
                       1+Tz*s
  G11(s) = Kp * ---------------------- * exp(-Td*s)
                1+2*Zeta*Tw*s+(Tw*s)^2

         Kp = NaN
         Tw = NaN
       Zeta = NaN
         Td = NaN
         Tz = NaN

  From input 2 to output 1:
             Kp
  G12(s) = ---------- * exp(-Td*s)
            1+Tp1*s

        Kp = NaN
       Tp1 = NaN
        Td = NaN

Parameterization:
    {'P2DUZ'}    {'P1D'}
   Number of free coefficients: 8
   Use "getpvec", "getcov" for parameters and their uncertainties.

Status:
Created by direct construction or transformation. Not estimated.
I valori del parametro sono impostati su NaN poiché non sono ancora stati estimati.
Specifica delle ipotesi iniziali per i ritardi
Impostare la proprietà del ritardo di tempo dell’oggetto del modello su 2.5 min e 5 min per ciascuna coppia in ingresso/in uscita, come ipotesi iniziale. Impostare inoltre un limite superiore per il ritardo in quanto sono disponibili delle buone ipotesi iniziali.
midproc0.Structure(1,1).Td.Value = 2.5;
midproc0.Structure(1,2).Td.Value = 5;
midproc0.Structure(1,1).Td.Maximum = 3;
midproc0.Structure(1,2).Td.Maximum = 7;
Nota
Quando si impostano i vincoli, è necessario specificare i ritardi in termini di unità effettive di tempo (minuti, in questo caso) e non in numero di campioni.
Stima dei parametri del modello utilizzando procest
procest è uno stimatore iterativo di modelli di processo, ossia utilizza un algoritmo iterativo non lineare dei minimi quadrati per minimizzare la funzione di costo. La funzione di costo è la somma ponderata dei quadrati degli errori.
A seconda degli argomenti, procest stima diversi modelli polinomiali black-box. Ad esempio, è possibile utilizzare procest per stimare parametri per strutture di modello di funzioni di trasferimento lineari a tempo continuo, nello spazio degli stati o polinomiali. Per utilizzare procest, è necessario fornire una struttura del modello con parametri non noti e dati di stima come argomenti di ingresso.
Per questa sezione del tutorial, è necessario che la struttura del modello sia già stata definita, come descritto in Specifica della struttura del modello di processo. Utilizzare midproc0 come struttura del modello e Ze1 come dati di stima:
midproc = procest(Ze1,midproc0);
present(midproc)
midproc =

Process model with 2 inputs: y = G11(s)u1 + G12(s)u2
  From input "ConsumptionRate" to output "Production":
                       1+Tz*s
  G11(s) = Kp * ---------------------- * exp(-Td*s)
                1+2*Zeta*Tw*s+(Tw*s)^2

         Kp = -1.1807 +/- 0.29986
         Tw = 1.6437 +/- 714.6
       Zeta = 16.036 +/- 6958.9
         Td = 2.426 +/- 64.276
         Tz = -109.19 +/- 63.736

  From input "Current" to output "Production":
             Kp
  G12(s) = ---------- * exp(-Td*s)
            1+Tp1*s

        Kp = 10.264 +/- 0.048404
       Tp1 = 2.049 +/- 0.054901
        Td = 4.9175 +/- 0.034374

Parameterization:
    {'P2DUZ'}    {'P1D'}
   Number of free coefficients: 8
   Use "getpvec", "getcov" for parameters and their uncertainties.

Status:
Termination condition: Maximum number of iterations reached..
Number of iterations: 20, Number of function evaluations: 279

Estimated using PROCEST on time domain data "Ze1".
Fit to estimation data: 86.2%
FPE: 6.081, MSE: 5.984
More information in model's "Report" property.
A differenza dei modelli polinomiali a tempo discreto, i modelli a tempo continuo permetto di stimare i ritardi. In questo caso, i valori del ritardo stimati sono diversi dalle ipotesi iniziali specificate, rispettivamente di 2.5 e 5. Le grandi incertezze nei valori stimati dei parametri di G_1(s) indicano che la dinamica dall’ingresso 1 all’uscita non è acquisita correttamente.
Per saperne di più sulla stima dei modelli, vedere Modelli di processo.
Validazione del modello
In questa sezione del tutorial, si crea un grafico che paragona l’uscita effettiva con l’uscita del modello.
compare(Zv1,midproc)
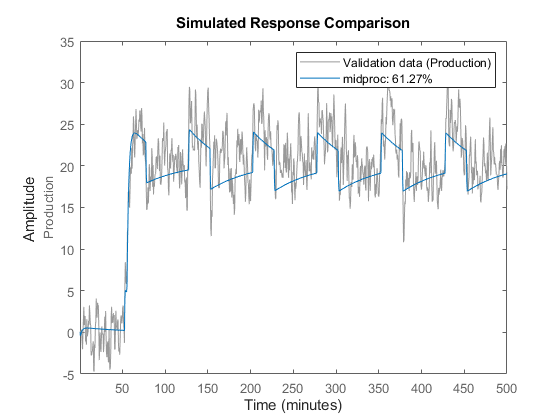
Il grafico mostra che l’uscita del modello concorda ragionevolmente con l’uscita misurata: la concordanza tra i dati del modello e i dati di validazione è del 60%.
Stima di un modello di processo con modello di rumore
Questa sezione del tutorial mostra come stimare un modello di processo includendo un modello di rumore nella stima. Usualmente, l’inclusione di un modello di rumore migliora i risultati predittivi del modello, ma non necessariamente i risultati della simulazione.
Utilizzare i seguenti comandi per specificare un rumore ARMA del primo ordine:
Opt = procestOptions;
Opt.DisturbanceModel = 'ARMA1';
midproc2 = procest(Ze1,midproc0,Opt);
È possibile digitare 'dist' anziché 'DisturbanceModel'. I nomi delle proprietà non fanno distinzione tra lettere maiuscole e lettere minuscole ed è necessario includere solo la parte di nome che identifica la proprietà in modo univoco.
Paragonare il modello risultante con i dati misurati.
compare(Zv1,midproc2)

Il grafico mostra che l’uscita del modello mantiene una ragionevole concordanza con l’uscita dei dati di validazione.
Stima di modelli polinomiali black-box
Ordini del modello per la stima di modelli polinomiali
In questa sezione del tutorial, si stimano diversi tipi di modelli polinomiali black-box in ingresso-in uscita.
È necessario che i dati siano già stati preparati, come descritto in Preparazione dei dati.
È possibile utilizzare i seguenti risultati precedenti degli ordini del modello stimato per specificare gli ordini del modello polinomiale:
Per la prima combinazione in ingresso/in uscita, utilizzare:
Due poli, corrispondenti a na=2 nel modello ARX.
Uno zero, corrispondente a nb=2 nel modello ARX.
Un ritardo di 5, corrispondente a nk= 5 campioni (o 2,5 minuti) nel modello ARX.
Per la seconda combinazione in ingresso/in uscita, utilizzare:
Un polo, corrispondente a na=1 nel modello ARX.
Nessuno zero, corrispondente a nb=1 nel modello ARX.
Un ritardo di 10, corrispondente a nk= 10 campioni (o 5 minuti) nel modello ARX.
Stima di un modello lineare ARX
Informazioni sui modelli ARX. Per un sistema a ingresso singolo/uscita singola (SISO), la struttura del modello ARX è:
y(t) rappresenta l’uscita al momento t, u(t) rappresenta l’ingresso al momento t, na è il numero di poli, nb è il numero di zeri più 1, nk è il numero di campioni prima che l’ingresso influisca sull’uscita del sistema (chiamato ritardo o tempo morto del modello) ed e(t) è il disturbo del rumore bianco.
La struttura del modello ARX non fa distinzione tra i poli per i singoli percorsi in ingresso/in uscita: dividendo l’equazione ARX per A, che contiene i poli, mostra che A è visualizzato nel denominatore per entrambi gli ingressi. Pertanto, è possibile impostare na sulla somma dei poli per ciascuna coppia in ingresso/in uscita che, in questo caso, è uguale a 3.
Il prodotto System Identification Toolbox stima i parametri e utilizzando i dati e gli ordini del modello specificati.
Stima dei modelli ARX utilizzando arx. Usare arx per calcolare i coefficienti polinomiali utilizzando il metodo veloce e non iterativo arx:
marx = arx(Ze1,'na',3,'nb',[2 1],'nk',[5 10]);
present(marx) % Displays model parameters
              % with uncertainty information
marx =
Discrete-time ARX model: A(z)y(t) = B(z)u(t) + e(t)

  A(z) = 1 - 1.027 (+/- 0.02907) z^-1 + 0.1678 (+/- 0.042) z^-2 + 0.01289 (
                                                         +/- 0.02583) z^-3

  B1(z) = 1.86 (+/- 0.189) z^-5 - 1.608 (+/- 0.1888) z^-6

  B2(z) = 1.612 (+/- 0.07392) z^-10

Sample time: 0.5 minutes

Parameterization:
   Polynomial orders:   na=3   nb=[2 1]   nk=[5 10]
   Number of free coefficients: 6
   Use "polydata", "getpvec", "getcov" for parameters and their uncertainties.

Status:
Estimated using ARX on time domain data "Ze1".
Fit to estimation data: 90.7% (prediction focus)
FPE: 2.768, MSE: 2.719
More information in model's "Report" property.
MATLAB stima i polinomi A, B1 e B2. L’incertezza per ciascuno dei parametri del modello è calcolata alla deviazione standard di 1, visualizzata tra parentesi accanto a ciascun valore del parametro.
In alternativa, è possibile utilizzare la seguente sintassi abbreviata e specificare gli ordini del modello come vettore unico:
marx = arx(Ze1,[3 2 1 5 10]);
Accesso ai dati del modello. Il modello stimato marx è un oggetto idpoly a tempo discreto. Per ottenere le proprietà di questo oggetto del modello, è possibile utilizzare la funzione get:
get(marx)
                 A: [1 -1.0267 0.1678 0.0129]
                 B: {[0 0 0 0 0 1.8599 -1.6084]  [0 0 0 0 0 0 0 0 0 0 1.6118]}
                 C: 1
                 D: 1
                 F: {[1]  [1]}
    IntegrateNoise: 0
          Variable: 'z^-1'
           IODelay: [0 0]
         Structure: [1×1 pmodel.polynomial]
     NoiseVariance: 2.7436
        InputDelay: [2×1 double]
       OutputDelay: 0
         InputName: {2×1 cell}
         InputUnit: {2×1 cell}
        InputGroup: [1×1 struct]
        OutputName: {'Production'}
        OutputUnit: {'mg/min'}
       OutputGroup: [1×1 struct]
             Notes: [0×1 string]
          UserData: []
              Name: ''
                Ts: 0.5000
          TimeUnit: 'minutes'
      SamplingGrid: [1×1 struct]
            Report: [1×1 idresults.arx]
È possibile accedere alle informazioni memorizzate da queste proprietà utilizzando la notazione col punto. Ad esempio, è possibile calcolare i poli discreti del modello trovando le radici del polinomio A.
marx_poles = roots(marx.a)
marx_poles =

    0.7953
    0.2877
   -0.0564
In questo caso, si accede al polinomio A utilizzando marx.a.
Il modello marx descrive la dinamica del sistema utilizzando tre poli discreti.
Suggerimento
È inoltre possibile calcolare direttamente i poli di un modello utilizzando pole.
Per saperne di più. Per saperne di più sulla stima dei modelli polinomiali, vedere Modelli polinomiali di input-di output.
Per ulteriori informazioni sull’accesso ai dati del modello, vedere Estrazione dei dati.
Stima dei modelli nello spazio degli stati
Informazioni sui modelli nello spazio degli stati. La struttura generale del modello nello spazio degli stati è:
y(t) rappresenta l’uscita al momento t, u(t) rappresenta l’ingresso al momento t, x(t) è il vettore di stato all’istante t ed e(t) è il disturbo del rumore bianco.
É necessario specificare un singolo intero come ordine del modello (dimensione del vettore di stato) per stimare un modello nello spazio degli stati. Per impostazione predefinita, il ritardo è pari a 1.
Il prodotto System Identification Toolbox stima le matrici nello spazio degli stati A, B, C, D e K utilizzando l’ordine del modello e i dati specificati.
La struttura del modello nello spazio degli stati è una buona scelta per una stima rapida, poiché contiene solo due parametri: n è il numero di poli (la dimensione della matrice A) e nk è il ritardo.
Stima dei modelli nello spazio degli stati utilizzando n4sid. Utilizzare il comando n4sid per specificare un intervallo di ordini del modello e valutare la prestazione di diversi modelli nello spazio degli stati (ordini da 2 a 8):
mn4sid = n4sid(Ze1,2:8,'InputDelay',[4 9]);Questo comando usa il metodo veloce, non iterativo (sottospazio) e apre il grafico seguente. Si utilizza questo grafico per decidere quali stati forniscono un contributo relativo significativo al comportamento in ingresso/in uscita e quali stati forniscono il contributo minore.
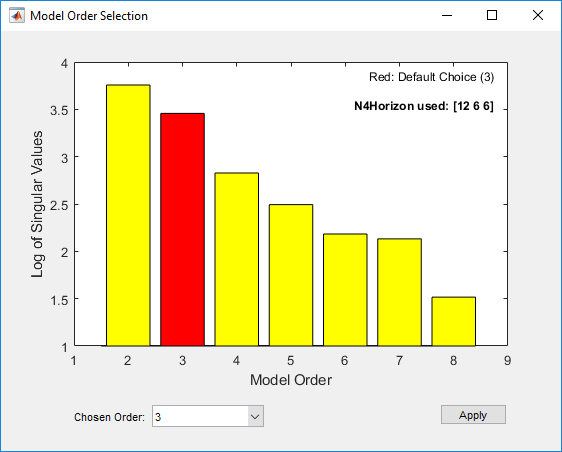
L’asse verticale è una misura relativa di quanto ciascuno stato contribuisca al comportamento in ingresso/in uscita del modello (registro dei valori singolari della matrice di covarianza). L’asse orizzontale corrisponde all’ordine del modello n. Questo grafico suggerisce n=3, indicato da un rettangolo rosso.
Il campo Chosen Order dell’ordine visualizza l’ordine del modello raccomandato, in questo caso 3 per impostazione predefinita. È possibile modificare la selezione dell’ordine utilizzando l’elenco a discesa Chosen Order. Applicare il valore nel campo Chosen Order e chiudere la finestra di selezione dell’ordine facendo clic su Apply.
Per impostazione predefinita, n4sid utilizza una parametrizzazione libera del modulo nello spazio degli stati. Per stimare invece una forma canonica, impostare il valore della proprietà SSParameterization su 'Canonical'. È inoltre possibile specificare il ritardo (in campioni) da ingresso-a uscita utilizzando la proprietà 'InputDelay'.
mCanonical = n4sid(Ze1,3,'SSParameterization','canonical','InputDelay',[4 9]);
present(mCanonical);  %  Display model properties
mCanonical =
  Discrete-time identified state-space model:
    x(t+Ts) = A x(t) + B u(t) + K e(t)
       y(t) = C x(t) + D u(t) + e(t)

  A =
                       x1                  x2                  x3
   x1                   0                   1                   0
   x2                   0                   0                   1
   x3  0.0737 +/- 0.05919  -0.6093 +/- 0.1626    1.446 +/- 0.1287

  B =
             ConsumptionR             Current
   x1   1.844 +/-   0.175   0.5633 +/-  0.122
   x2   1.063 +/-  0.1673    2.308 +/- 0.1222
   x3  0.2779 +/- 0.09615    1.878 +/- 0.1058

  C =
               x1  x2  x3
   Production   1   0   0

  D =
               ConsumptionR       Current
   Production             0             0

  K =
               Production
   x1  0.8674 +/- 0.03169
   x2  0.6849 +/- 0.04145
   x3  0.5105 +/- 0.04352

  Input delays (sampling periods): 4  9

Sample time: 0.5 minutes

Parameterization:
   CANONICAL form with indices: 3.
   Feedthrough: none
   Disturbance component: estimate
   Number of free coefficients: 12
   Use "idssdata", "getpvec", "getcov" for parameters and their uncertainties.

Status:
Estimated using N4SID on time domain data "Ze1".
Fit to estimation data: 91.39% (prediction focus)
FPE: 2.402, MSE: 2.331
More information in model's "Report" property.
Nota
mn4sid e mCanonical sono modelli a tempo discreto. Per stimare un modello a tempo continuo, impostare la proprietà 'Ts' su 0 nel comando di stima o utilizzare il comando ssest:
mCT1 = n4sid(Ze1, 3, 'Ts', 0, 'InputDelay', [2.5 5])
mCT2 = ssest(Ze1, 3,'InputDelay', [2.5 5])
Per saperne di più. Per saperne di più sulla stima dei modelli nello spazio degli stati, vedere Modelli stato-spazio.
Stima di un modello Box-Jenkins
Informazioni sui modelli Box-Jenkins. La struttura generale del Box-Jenkins (BJ) è:
Per stimare un modello BJ, è necessario specificare i parametri nb, nf, nc, nd e nk.
Mentre la struttura del modello ARX non fa distinzione tra i poli per i singoli percorsi in ingresso/in uscita, il modello BJ offre una flessibilità maggiore per la modellazione dei poli e degli zeri del disturbo separata dai poli e dagli zeri della dinamica del sistema.
Stima di un modello BJ utilizzando polyest. È possibile utilizzare polyest per stimare il modello BJ. polyest è un metodo iterativo la cui sintassi generale è la seguente:
polyest(data,[na nb nc nd nf nk]);
Per stimare il modello BJ, digitare:
na = 0;
nb = [ 2 1 ];
nc = 1;
nd = 1;
nf = [ 2 1 ];
nk = [ 5 10];
mbj = polyest(Ze1,[na nb nc nd nf nk]);
Questo comando specifica nf=2, nb=2, nk=5 per il primo ingresso e nf=nb=1 e nk=10 per il secondo ingresso.
Visualizzare le informazioni del modello.
present(mbj)
mbj =
Discrete-time BJ model: y(t) = [B(z)/F(z)]u(t) + [C(z)/D(z)]e(t)
  B1(z) = 1.823 (+/- 0.1792) z^-5 - 1.315 (+/- 0.2367) z^-6

  B2(z) = 1.791 (+/- 0.06431) z^-10

  C(z) = 1 + 0.1068 (+/- 0.04009) z^-1

  D(z) = 1 - 0.7452 (+/- 0.02694) z^-1

  F1(z) = 1 - 1.321 (+/- 0.06936) z^-1 + 0.5911 (+/- 0.05514) z^-2

  F2(z) = 1 - 0.8314 (+/- 0.006441) z^-1

Sample time: 0.5 minutes

Parameterization:
   Polynomial orders:   nb=[2 1]   nc=1   nd=1   nf=[2 1]
   nk=[5 10]
   Number of free coefficients: 8
   Use "polydata", "getpvec", "getcov" for parameters and their uncertainties.

Status:
Termination condition: Near (local) minimum, (norm(g) < tol)..
Number of iterations: 6, Number of function evaluations: 13

Estimated using POLYEST on time domain data "Ze1".
Fit to estimation data: 90.75% (prediction focus)
FPE: 2.733, MSE: 2.689
More information in model's "Report" property.
L’incertezza per ciascuno dei parametri del modello è calcolata alla deviazione standard di 1, visualizzata tra parentesi accanto a ciascun valore del parametro.
I polinomi C e D forniscono rispettivamente il numeratore e il denominatore del modello di rumore.
Suggerimento
In alternativa, è possibile utilizzare la seguente sintassi abbreviata che specifica gli ordini come vettore unico:
mbj = bj(Ze1,[2 1 1 1 2 1 5 10]);
bj è una versione di polyest che stima specificatamente la struttura del modello BJ.
Per saperne di più. Per saperne di più sull’identificazione dei modelli polinomiali in ingresso-in uscita, come BJ, vedere Modelli polinomiali di input-di output.
Paragone tra l’uscita del modello e l’uscita misurata
Paragonare l’uscita dei modelli ARX, nello spazio degli stati e Box-Jenkins all’uscita misurata.
compare(Zv1,marx,mn4sid,mbj)
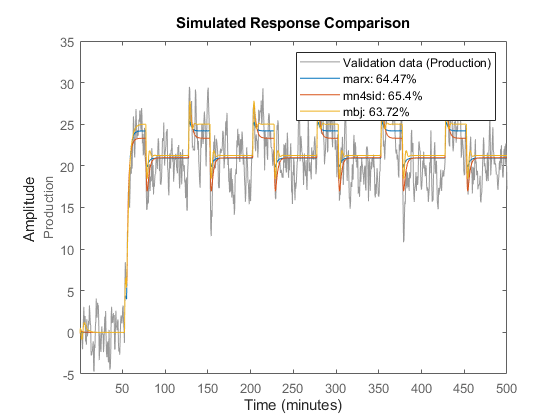
compare traccia l’uscita misurata nell’insieme dei dati di validazione rispetto all’uscita simulata dai modelli. I dati in ingresso dall’insieme di dati di validazione servono come ingresso per i modelli.
Eseguire l’analisi residua sui modelli ARX, nello spazio degli stati e Box-Jenkins.
resid(Zv1,marx,mn4sid,mbj)
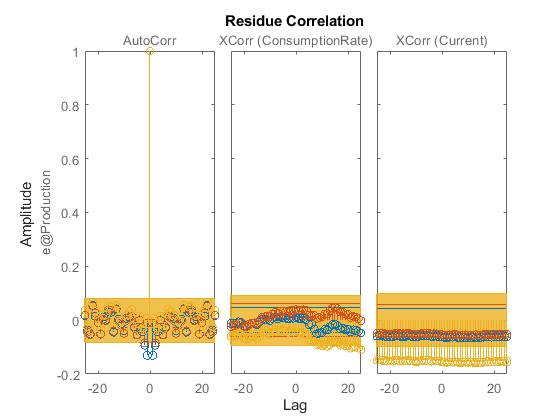
Tutti e tre i modelli simulano l’uscita ugualmente bene e hanno residui non correlati. Pertanto, scegliere il modello ARX poiché è il modello più semplice dei tre modelli polinomiali in ingresso-in uscita e acquisisce adeguatamente la dinamica del processo.
Simulazione e previsione dell’uscita del modello
Simulazione dell’uscita del modello
In questa sezione del tutorial, viene simulata l’uscita del modello. È necessario che il modello a tempo continuo midproc2 sia già stato creato, come descritto in Stima dei modelli di processo.
La simulazione dell’uscita del modello richiede le seguenti informazioni:
I valori in ingresso del modello
Le condizioni iniziali della simulazione (chiamate anche stati iniziali)
Ad esempio, i seguenti comandi utilizzano i comandi iddata e idinput per creare un insieme di dati in ingresso e sim per simulare l’uscita del modello:
% Create input for simulation
U = iddata([],idinput([200 2]),'Ts',0.5,'TimeUnit','min');
% Simulate the response setting initial conditions equal to zero
ysim_1 = sim(midproc2,U);
Per massimizzare l’adattamento tra la risposta simulata di un modello all’uscita misurata per lo stesso ingresso, è possibile calcolare le condizioni iniziali corrispondenti ai dati misurati. Le migliori condizioni iniziali di adattamento possono essere ottenute utilizzando findstates nella versione nello spazio degli stati del modello stimato. I seguenti comandi stimano gli stati iniziali X0est dall’insieme di dati Zv1:
Previsione dell’uscita futura
Molte applicazioni di progettazione richiedono che le uscite future di un sistema dinamico vengano previste utilizzando i dati passati in ingresso/in uscita.
Ad esempio, utilizzare predict per prevedere la risposta del modello anticipata di cinque passaggi:
predict(midproc2,Ze1,5)
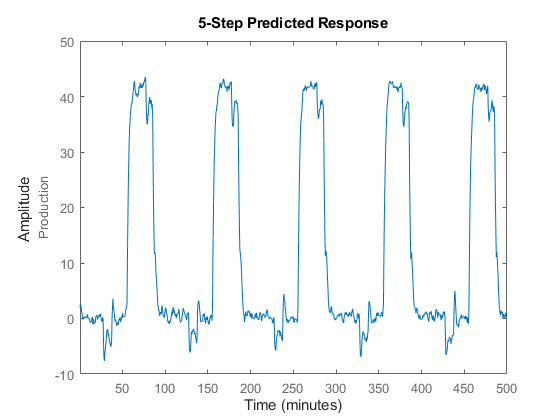
Utilizzare pe per calcolare l’errore di previsione Err tra l’uscita prevista di midproc2 e l’uscita misurata. Quindi, tracciare lo spettro di errore utilizzando il comando spectrum.