lcolorbar
Color bar with text labels
Description
lcolorbar( displays a vertical color
bar, with labels specified by the text in labels)labels, to the right of the
current axes.
lcolorbar(
specifies options for the color bar using name-value arguments.labels,Name,Value)
Examples
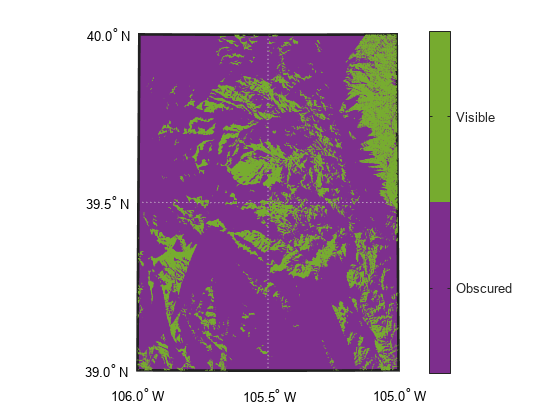
Import elevation data for a region surrounding South Boulder Peak in Colorado. Calculate the viewshed for a sample point 1000 meters above the terrain.
[Z,R] = readgeoraster("n39_w106_3arc_v2.dt1","OutputType","double");
[vis,visR] = viewshed(Z,R,39.6,-105.6,1000);
Display the viewshed on a map, using green for visible areas and purple for obscured areas.
figure
usamap(vis,visR)
geoshow(vis,visR,"DisplayType","surface")
cmap = [0.4940 0.1840 0.5560; 0.4660 0.6740 0.1880];
Add a labeled color bar. Avoid truncating the text by moving the color bar to the left.
colormap(cmap)
h = lcolorbar(["Obscured" "Visible"]);
h.Position(1) = h.Position(1)-0.1;
Input Arguments
Name-Value Arguments
Output Arguments
Limitations
In some cases, such as when adding color bars to subplots or
when changing the colormap of a specified axes, the lcolorbar function
produces unexpected results. In these cases, create a labeled color bar by using the colorbar function instead of the lcolorbar function.
This code shows how to make a labeled color bar with 5 labels by using the
colorbar function. Within the code:
Create an axes object, change the colormap, and add a color bar
Place a tick mark at the center of each color band
Add the tick labels
ax = axes;
n = 5;
colormap(ax,jet(n))
cb = colorbar;

ticks = linspace(ax.CLim(1),ax.CLim(2),1 + 2*n);
ticks(1:2:end) = [];
cb.Ticks = ticks;

labels = ["apples","oranges","grapes","peaches","melons"];
cb.TickLabels = labels;
Version History
Introduced before R2006a