intensityFeatures
Description
Examples
Load an X-ray image into the workspace as a medicalImage
object. Visualize the image.
data = medicalImage("forearmXrayImage1.dcm");
I = data.Pixels;
figure
imshow(I,[])
Draw two regions of interest (ROI) in the X-ray image. Create masks from the ROIs.
roi1 = drawassisted(Color="g"); roi2 = drawassisted(Color="r");
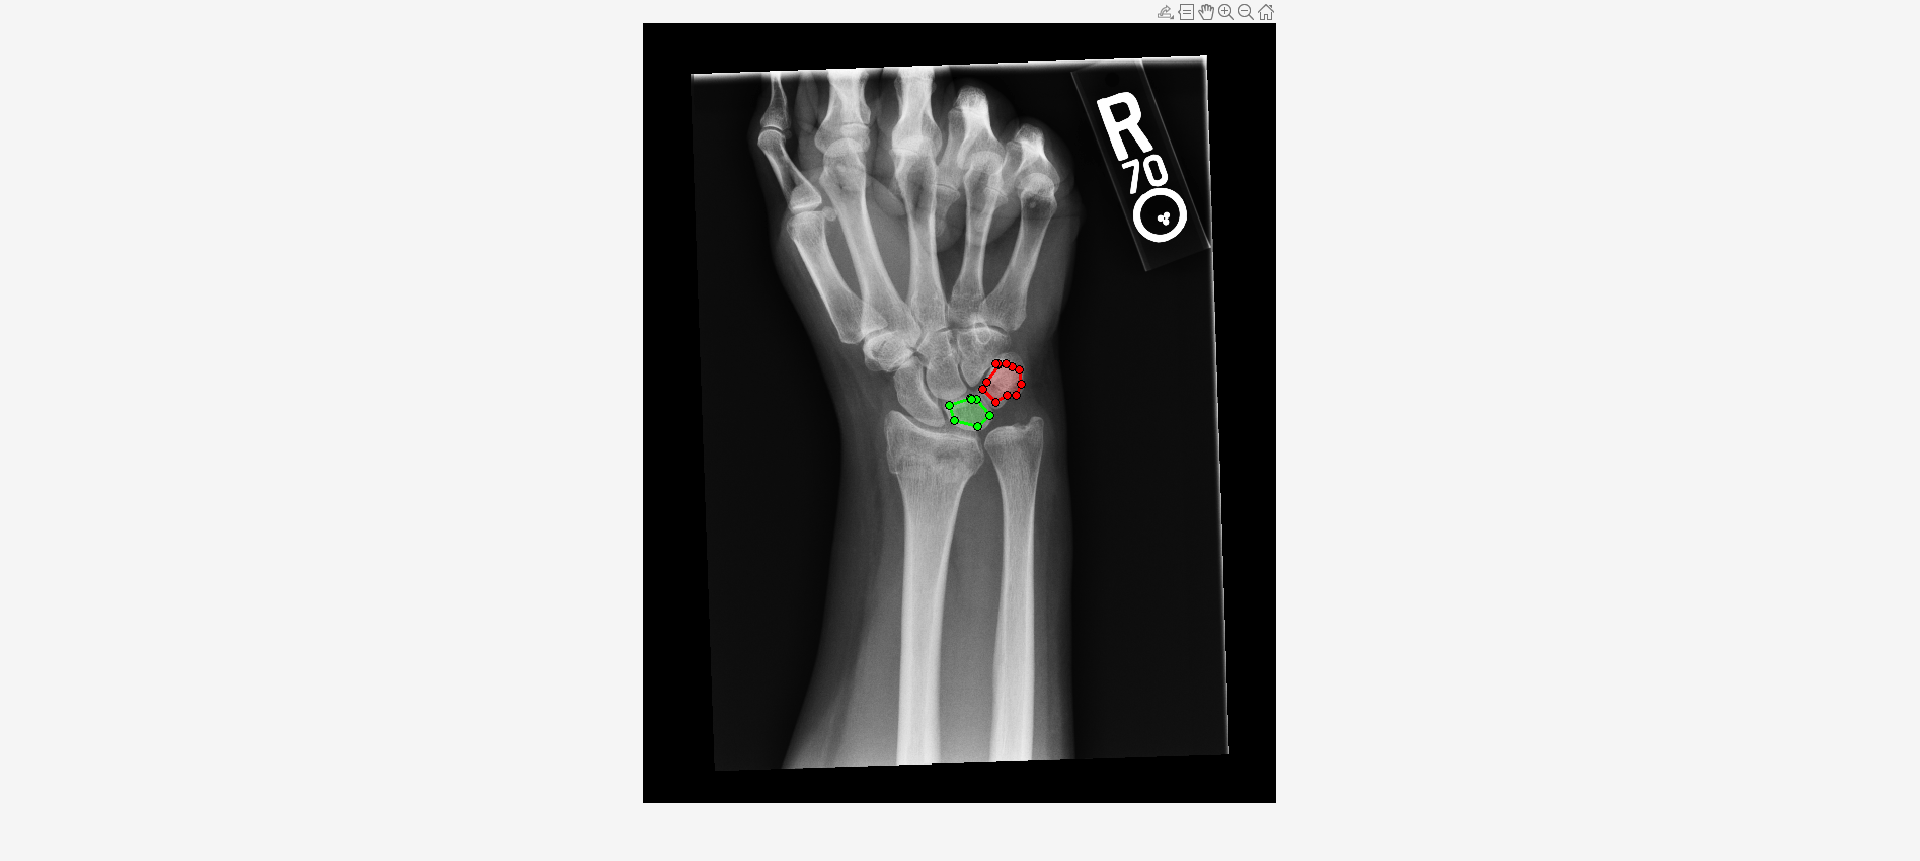
mask1 = createMask(roi1,I); mask2 = createMask(roi2,I);
Create an ROI label matrix, using different labels for the two ROIs. Create a medicalImage
object of the ROI label data.
mask = zeros(size(I));
mask(mask1) = 1;
mask(mask2) = 2;
info = dicominfo("forearmXrayImage1.dcm");
roi = medicalImage(mask,info);
Create a radiomics
object from the X-ray image data and ROI label data.
R = radiomics(data,roi)
R = radiomics with properties: Data: [1×1 medicalImage] ROILabel: [1×1 medicalImage] Resample: 0 Resegment: 1 Discretize: 1 DiscretizeIVH: 1 ResampledVoxelSpacing: [] DataResampleMethod: [] MaskResampleMethod: [] ResegmentationRange: [] ExcludeOutliers: 1 DiscreteBinSizeOrBinNumber: [] DiscreteMethod: 'FixedBinNumber' DiscreteIVHBinSizeOrBinNumber: [] DiscreteIVHMethod: 'FixedBinNumber'
Compute intensity features for both ROIs.
I = intensityFeatures(R)
I=2×50 table
LabelID LocalIntensityPeak2D GlobalIntensityPeak2D MeanIntensity2D IntensityVariance2D IntensitySkewness2D IntensityKurtosis2D MedianIntensity2D MinimumIntensity2D TenthIntensityPercentile2D NinetiethIntensityPercentile2D MaximumIntensity2D IntensityInterquartileRange2D IntensityRange2D MeanAbsoluteDeviation2D RobustMeanAbsoluteDeviation2D MedianAbsoluteDeviation2D CoefficientOfVariation2D QuartileCoefficientOfDispersion2D IntensityEnergy2D RootMeanSquare2D MeanDiscretisedIntensity2D DiscretisedIntensityVariance2D DiscretisedIntensitySkewness2D DiscretisedIntensityKurtosis2D MedianDiscretisedIntensity2D MinimumDiscretisedIntensity2D TenthDiscretisedIntensityPercentile2D NinetiethDiscretisedIntensityPercentile2D MaximumDiscretisedIntensity2D IntensityHistogramMode2D DiscretisedIntensityInterquartileRange2D DiscretisedIntensityRange2D IntensityHistogramMeanAbsoluteDeviation2D IntensityHistogramRobustMeanAbsoluteDeviation2D IntensityHistogramMedianAbsoluteDeviation2D IntensityHistogramCoeffcientOfVariation2D IntensityHistogramQuartileCoeffcientOfDispersion2D DiscretisedIntensityEntropy2D DiscretisedIntensityUniformity2D MaximumHistogramGradient2D MaximumHistogramGradientIntensity2D MinimumHistogramGradient2D MinimumHistogramGradientIntensity2D TenPercentVolumeFraction2D NinetyPercentVolumeFraction2D TenPercentIntensityFraction2D NinetyPercentIntensityFraction2D VolumeFractionDifference2D IntensityFractionDifference2D
_______ ____________________ _____________________ _______________ ___________________ ___________________ ___________________ _________________ __________________ __________________________ ______________________________ __________________ _____________________________ ________________ _______________________ _____________________________ _________________________ ________________________ _________________________________ _________________ ________________ __________________________ ______________________________ ______________________________ ______________________________ ____________________________ _____________________________ _____________________________________ _________________________________________ _____________________________ ________________________ ________________________________________ ___________________________ _________________________________________ _______________________________________________ ___________________________________________ _________________________________________ __________________________________________________ _____________________________ ________________________________ __________________________ ___________________________________ __________________________ ___________________________________ __________________________ _____________________________ _____________________________ ________________________________ __________________________ _____________________________
"1" 2309.2 2496.6 2314.4 69224 0.91582 0.3904 2250 1744 2036 2715 3310 332 1566 208.86 143.37 201.98 0.11368 0.072394 1.5284e+10 2329.3 57.671 696.64 0.91491 0.39031 51 1 30 98 157 42 33 156 20.951 14.421 20.26 0.45766 0.2973 6.5219 0.013582 23.5 49 -22.5 47 0.98971 0.0028399 622 188 0.98687 434
"2" 2349.6 2355.3 2438.5 1.3586e+05 -0.72827 -0.053588 2500 1374 1933 2847 3145 534 1771 301.53 217.85 298.11 0.15116 0.10823 2.3464e+10 2466.2 94.871 1067.5 -0.73003 -0.049838 100 1 50 131 157 127 47 156 26.725 19.343 26.418 0.34439 0.24103 6.8585 0.010188 14 88 -16.5 130 0.97641 0.020477 833 317 0.95594 516
Import a computed tomography (CT) image volume and the corresponding ROI mask volume from the IBSI validation data set [1][2][3] as medicalVolume
objects.
unzip("CTImageMaskNIfTI.zip") data = medicalVolume("CT_image.nii.gz"); roi = medicalVolume("CT_mask.nii.gz");
Visualize a slice of the CT image volume and the corresponding ROI.
figure
imshowpair(data.Voxels(:,:,20),roi.Voxels(:,:,20),"montage")
Create a radiomics
object, using the CT image volume and ROI mask volume, with default preprocessing options.
R = radiomics(data,roi)
R = radiomics with properties: Data: [1×1 medicalVolume] ROILabel: [1×1 medicalVolume] Resample: 1 Resegment: 1 Discretize: 1 DiscretizeIVH: 1 ResampledVoxelSpacing: 1 DataResampleMethod: 'linear' MaskResampleMethod: 'linear' ResegmentationRange: [] ExcludeOutliers: 1 DiscreteBinSizeOrBinNumber: [] DiscreteMethod: 'FixedBinNumber' DiscreteIVHBinSizeOrBinNumber: [] DiscreteIVHMethod: 'FixedBinNumber'
Compute the local intensity features of the ROI in the 2-D resampled CT image volume.
I = intensityFeatures(R,Type=["LocalIntensity","IntensityHistogram"],SubType="2D")
I=1×26 table
LabelID LocalIntensityPeak2D GlobalIntensityPeak2D MeanDiscretisedIntensity2D DiscretisedIntensityVariance2D DiscretisedIntensitySkewness2D DiscretisedIntensityKurtosis2D MedianDiscretisedIntensity2D MinimumDiscretisedIntensity2D TenthDiscretisedIntensityPercentile2D NinetiethDiscretisedIntensityPercentile2D MaximumDiscretisedIntensity2D IntensityHistogramMode2D DiscretisedIntensityInterquartileRange2D DiscretisedIntensityRange2D IntensityHistogramMeanAbsoluteDeviation2D IntensityHistogramRobustMeanAbsoluteDeviation2D IntensityHistogramMedianAbsoluteDeviation2D IntensityHistogramCoeffcientOfVariation2D IntensityHistogramQuartileCoeffcientOfDispersion2D DiscretisedIntensityEntropy2D DiscretisedIntensityUniformity2D MaximumHistogramGradient2D MaximumHistogramGradientIntensity2D MinimumHistogramGradient2D MinimumHistogramGradientIntensity2D
_______ ____________________ _____________________ __________________________ ______________________________ ______________________________ ______________________________ ____________________________ _____________________________ _____________________________________ _________________________________________ _____________________________ ________________________ ________________________________________ ___________________________ _________________________________________ _______________________________________________ ___________________________________________ _________________________________________ __________________________________________________ _____________________________ ________________________________ __________________________ ___________________________________ __________________________ ___________________________________
"1" 71.689 78.084 10.488 10.846 -0.069 -0.1125 11 1 6 15 20 10 5 19 2.6421 2.0664 2.639 0.31401 0.2381 3.761 0.085523 351.5 7 -344 13
[1] Vallières, Martin, Carolyn R. Freeman, Sonia R. Skamene, and Issam El Naqa. “A Radiomics Model from Joint FDG-PET and MRI Texture Features for the Prediction of Lung Metastases in Soft-Tissue Sarcomas of the Extremities.” The Cancer Imaging Archive, 2015. https://doi.org/10.7937/K9/TCIA.2015.7GO2GSKS.
[2] Vallières, M, C R Freeman, S R Skamene, and I El Naqa. “A Radiomics Model from Joint FDG-PET and MRI Texture Features for the Prediction of Lung Metastases in Soft-Tissue Sarcomas of the Extremities.” Physics in Medicine and Biology 60, no. 14 (July 7, 2015): 5471–96. https://doi.org/10.1088/0031-9155/60/14/5471.
[3] Clark, Kenneth, Bruce Vendt, Kirk Smith, John Freymann, Justin Kirby, Paul Koppel, Stephen Moore, et al. “The Cancer Imaging Archive (TCIA): Maintaining and Operating a Public Information Repository.” Journal of Digital Imaging 26, no. 6 (December 2013): 1045–57. https://doi.org/10.1007/s10278-013-9622-7.
Input Arguments
Name-Value Arguments
Specify optional pairs of arguments as
Name1=Value1,...,NameN=ValueN
, where Name
is
the argument name and Value
is the corresponding value.
Name-value arguments must appear after other arguments, but the order of the
pairs does not matter.
Example: intensityFeatures(R,Type="LocalIntensity",SubType="2D")
computes the local intensity features on 2-D resampled data.
Category of intensity features to compute, specified as one or more of these options.
"LocalIntensity"
"IntensityBasedStatistics"
"IntensityHistogram"
"IntensityVolumeHistogram"
"all"
If you specify "all"
, the function computes every
category of intensity features. For more information on which specific intensity
features each category includes, see IBSI Standard and Radiomics Function Feature Correspondences.
Data Types: char
| string
Resampling from which to compute intensity features, specified as one of these options.
"2D"
— Computes features from the 2-D resampled data. This is the default option for 2-D data, when theData
andROILabel
properties of theradiomics
objectR
are 2-D matrices ormedicalImage
objects."3D"
— Computes features from the 3-D resampled data. This is the default option for 3-D data, when theData
andROILabel
properties of theradiomics
objectR
are 3-D arrays ormedicalVolume
objects. 3-D resampling is not applicable for 2-D data."all"
— Computes features for all applicable options.
For 3-D data, when you perform 3-D resampling of the volume, the function makes the voxel spacing along all three spatial dimensions isotropic. However, when you perform 2-D resampling of the volume, the function makes the voxel spacing along only the x- and y-dimensions isotropic, while retaining the voxel spacing of the input volume along the z-dimension.
Data Types: char
| string
Output Arguments
Intensity features, returned as a table. The first column in I
is
LabelID
. The subsequent columns are the intensity features. Each
row of the table corresponds to an ROI. For more details on which intensity features are
computed in each Type
and SubType
, see IBSI Standard and Radiomics Function Feature Correspondences.
Version History
Introduced in R2023bCompute intensity features for multiple regions of interest (ROIs) in a medical image or medical volume.
Compute one or more types of intensity features by specifying one or more options in the
name-value argument Type
.
MATLAB Command
You clicked a link that corresponds to this MATLAB command:
Run the command by entering it in the MATLAB Command Window. Web browsers do not support MATLAB commands.
Select a Web Site
Choose a web site to get translated content where available and see local events and offers. Based on your location, we recommend that you select: .
You can also select a web site from the following list
How to Get Best Site Performance
Select the China site (in Chinese or English) for best site performance. Other MathWorks country sites are not optimized for visits from your location.
Americas
- América Latina (Español)
- Canada (English)
- United States (English)
Europe
- Belgium (English)
- Denmark (English)
- Deutschland (Deutsch)
- España (Español)
- Finland (English)
- France (Français)
- Ireland (English)
- Italia (Italiano)
- Luxembourg (English)
- Netherlands (English)
- Norway (English)
- Österreich (Deutsch)
- Portugal (English)
- Sweden (English)
- Switzerland
- United Kingdom (English)