Create a Presentation Programmatically
This example shows how to create a PowerPoint® presentation by using the MATLAB® API for PowerPoint (PPT API). The example generates these slides:
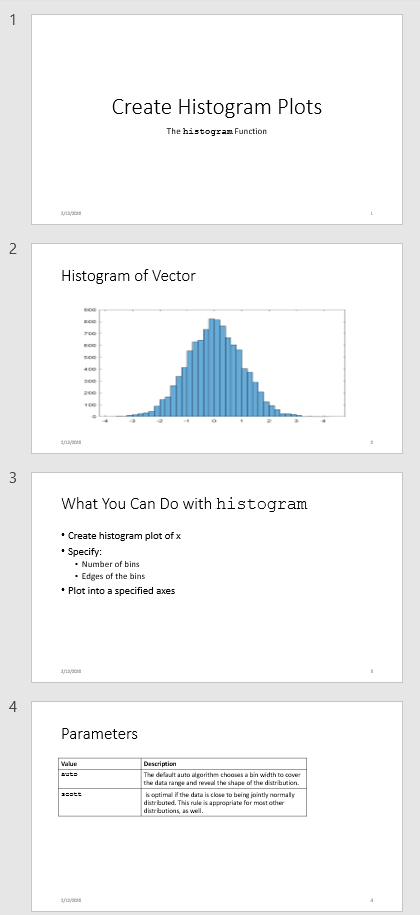
To programmatically create a presentation:
Create a presentation container.
Add slides.
Add content to the slides.
Generate the presentation.
Create a Presentation Container
Create an mlreportgen.ppt.Presentation object to contain the presentation. For this example, specify that the output file name is myPresentation and do not specify a template.
ppt = mlreportgen.ppt.Presentation("myPresentation.pptx");Because you did not specify a template, the PPT API uses the default template. A template defines the default slide layouts and styles. To create a custom template, see Set Up a PowerPoint Presentation Template. You can override the default style defined by a template by using format properties and objects. See Presentation Formatting Approaches.
Add Slides and Slide Content
To add a slide, use the add method and specify a slide layout that is available in the template. See Set Up a PowerPoint Presentation Template. This example uses these slide layouts that are included with the default template:
Title SlideTitle and PictureTitle and ContentTitle and Table
To add content to a slide, use the replace method to replace content placeholders with the new content. For more information about adding and replacing content, see Add and Replace Presentation Content. To use the replace method, you must specify the name that identifies a placeholder in the slide layout. For example, the Title Slide layout has a Title placeholder and a Subtitle placeholder. For information about how to find the content placeholder names for a particular slide layout, see Access PowerPoint Template Elements.
Add a Title Slide
To add a title slide, use the Title Slide layout.
titleSlide = add(ppt,"Title Slide");The Title Slide layout has these placeholders:
TitleSubtitle
Replace the Title placeholder with the title text.
replace(titleSlide,"Title","Create Histogram Plots");
Build the title text in pieces so that you can format the histogram function name in a different font.
subtitleText = mlreportgen.ppt.Paragraph("The ");
funcName = mlreportgen.ppt.Text("histogram");
funcName.Font = "Courier New";

append(subtitleText,funcName);
append(subtitleText," Function");
Replace the Subtitle placeholder with the text contained in SubtitleText.
replace(titleSlide,"Subtitle",subtitleText);Add a Slide with a Picture
Create an image file to use for the slide picture.
x = randn(10000,1);
h = histogram(x);
saveas(gcf,"myPlot_img.png");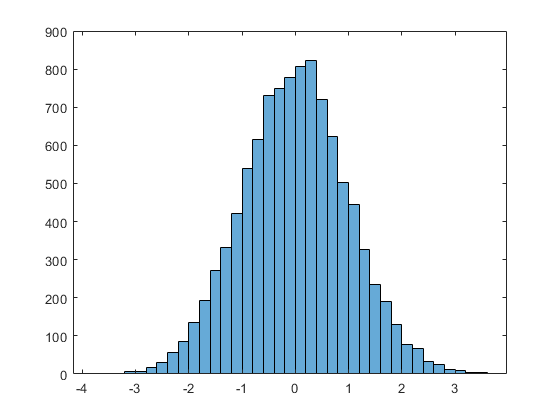
Create an mlreportgen.ppt.ppt.Picture object from the image file.
plot1 = mlreportgen.ppt.Picture("myPlot_img.png");Add a picture slide to the presentation by using a Title and Picture layout.
pictureSlide = add(ppt,"Title and Picture");The Title and Picture layout has these placeholders:
TitlePicture
Replace the Title placeholder with the title text and the Picture placeholder with plot1.
replace(pictureSlide,"Title","Histogram of Vector");
replace(pictureSlide,"Picture",plot1);
The contents of an image file are copied into the presentation when the presentation is closed. Do not delete or overwrite the image file before the presentation is closed. If your presentation program creates multiple image files, give them unique file names.
Add a Slide with Text
To add a slide with text, use the Title and Content layout.
textSlide = add(ppt,"Title and Content");The Title and Content layout has these placeholders:
TitleContent
Build the title text in pieces so that you can format the histogram function name in a different font.
titleText = mlreportgen.ppt.Paragraph("What You Can Do with ");
func = mlreportgen.ppt.Text("histogram");
func.Font = "Courier New";
append(titleText,func);
Replace the Title and Content placeholders.
replace(textSlide,"Title",titleText);
replace(textSlide,"Content",{"Create histogram plot of x",...
"Specify:",{"Number of bins","Edges of the bins"},...
"Plot into a specified axes"});
Add a Slide with a Table
To add a slide with a table, use the Title and Table layout.
tableSlide = add(ppt,"Title and Table");The Title and Table layout has these placeholders:
TitleTable
Replace the Title placeholder.
replace(tableSlide,"Title","Parameters");
You can use several approaches to create a table. See Create and Format Tables. This example builds a table row by row.
Create a table as an
mlreportgen.ppt.Tableobject.Create an
mlreportgen.ppt.TableRowobject for each row of the table.Create
mlreportgen.ppt.TableEntryobjects and append them to the table rows.
paramTable = mlreportgen.ppt.Table();
colSpecs(2) = mlreportgen.ppt.ColSpec("6in");
colSpecs(1) = mlreportgen.ppt.ColSpec("3in");
paramTable.ColSpecs = colSpecs;

tr1 = mlreportgen.ppt.TableRow();
tr1.Style = {mlreportgen.ppt.Bold(true)};

tr1te1Text = mlreportgen.ppt.Paragraph("Value");
tr1te2Text = mlreportgen.ppt.Paragraph("Description");
tr1te1 = mlreportgen.ppt.TableEntry();
tr1te2 = mlreportgen.ppt.TableEntry();
append(tr1te1,tr1te1Text);
append(tr1te2,tr1te2Text);
append(tr1,tr1te1);
append(tr1,tr1te2);

tr2 = TableRow();
tr2te1Text = mlreportgen.ppt.Paragraph("auto");
tr2te1Text.Font = "Courier New";
tr2te2Text = mlreportgen.ppt.Paragraph(...
    "The default auto algorithm chooses a bin width to ");
append(tr2te2Text,...
    "cover the data range and reveal the shape of the distribution.");
tr2te1 = TableEntry();
tr2te2 = TableEntry();
append(tr2te1,tr2te1Text);
append(tr2te2,tr2te2Text);
append(tr2,tr2te1);
append(tr2,tr2te2);

tr3 = mlreportgen.ppt.TableRow();
tr3te1Text = mlreportgen.ppt.Paragraph("scott");
tr3te1Text.Font = "Courier New";
tr3te2Text = mlreportgen.ppt.Paragraph(...
    " Is optimal if the data is close ");
append(tr3te2Text,...
    "to being jointly normally distributed. This rule is ");
append(tr3te2Text,...
    "appropriate for most other distributions, as well.");
tr3te1 = mlreportgen.ppt.TableEntry();
tr3te2 = mlreportgen.ppt.TableEntry();
append(tr3te1,tr3te1Text);
append(tr3te2,tr3te2Text);
append(tr3,tr3te1);
append(tr3,tr3te2);

append(paramTable,tr1);
append(paramTable,tr2);
append(paramTable,tr3);
Replace the Table placeholder with paramTable.
replace(tableSlide,"Table",paramTable);Generate and View the Presentation
close(ppt);
rptview(ppt);
See Also
mlreportgen.ppt.Presentation | mlreportgen.ppt.Slide | mlreportgen.ppt.Paragraph | mlreportgen.ppt.Text | mlreportgen.ppt.Table | mlreportgen.ppt.TableRow | mlreportgen.ppt.TableEntry