Main Content

spectralKurtosis

Spectral kurtosis for signals and spectrograms

Description

example

kurtosis = spectralKurtosis(x,f) returns the spectral kurtosis of the signal, x, over time. How the function interprets x depends on the shape of f.

example

kurtosis = spectralKurtosis(x,f,Name=Value) specifies options using one or more name-value arguments.

[kurtosis,spread,centroid] = spectralKurtosis(___) returns the spectral spread and spectral centroid. You can specify an input combination from any of the previous syntaxes.

example

spectralKurtosis(___) with no output arguments plots the spectral kurtosis.

  • If the input is in the time domain, the spectral kurtosis is plotted against time.

  • If the input is in the frequency domain, the spectral kurtosis is plotted against frame number.

Examples

collapse all

Create a chirp signal with white Gaussian noise and calculate the kurtosis using default parameters.

fs = 1000;
t = (0:1/fs:10)';
f1 = 300;
f2 = 400;
x = chirp(t,f1,10,f2) + randn(length(t),1);

kurtosis = spectralKurtosis(x,fs);

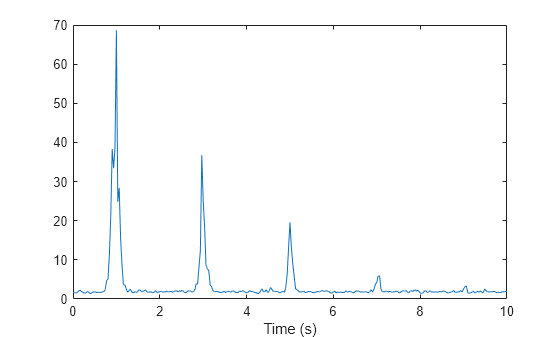
Plot the spectral kurtosis against time.

spectralKurtosis(x,fs)

Create a chirp signal with white Gaussian noise and then calculate the spectrogram using the stft function.

fs = 1000;
t = (0:1/fs:10)';
f1 = 300;
f2 = 400;
x = chirp(t,f1,10,f2) + randn(length(t),1);

[s,f] = stft(x,fs,FrequencyRange="onesided");
s = abs(s).^2;

Calculate the kurtosis of the spectrogram over time.

kurtosis = spectralKurtosis(s,f);

Plot the spectral kurtosis against the frame number.

spectralKurtosis(s,f)

Create a chirp signal with white Gaussian noise.

fs = 1000;
t = (0:1/fs:10)';
f1 = 300;
f2 = 400;
x = chirp(t,f1,10,f2) + randn(length(t),1);

Calculate the kurtosis of the power spectrum over time. Calculate the kurtosis for 50 ms Hamming windows of data with 25 ms overlap. Use the range from 62.5 Hz to fs/2 for the kurtosis calculation.

kurtosis = spectralKurtosis(x,fs, ...
                      Window=hamming(round(0.05*fs)), ...
                      OverlapLength=round(0.025*fs), ...
                      Range=[62.5,fs/2]);

Plot the kurtosis against time.

spectralKurtosis(x,fs, ...
              Window=hamming(round(0.05*fs)), ...
              OverlapLength=round(0.025*fs), ...
              Range=[62.5,fs/2])

Input Arguments

collapse all

Input signal, specified as a vector, matrix, or 3-D array. How the function interprets x depends on the shape of f.

Data Types: single | double

Sample rate or frequency vector in Hz, specified as a scalar or vector, respectively. How the function interprets x depends on the shape of f:

  • If f is a scalar, x is interpreted as a time-domain signal, and f is interpreted as the sample rate. In this case, x must be a real vector or matrix. If x is specified as a matrix, the columns are interpreted as individual channels.

  • If f is a vector, x is interpreted as a frequency-domain signal, and f is interpreted as the frequencies, in Hz, corresponding to the rows of x. In this case, x must be a real L-by-M-by-N array, where L is the number of spectral values at given frequencies of f, M is the number of individual spectra, and N is the number of channels.

  • The number of rows of x, L, must be equal to the number of elements of f.

Data Types: single | double

Name-Value Arguments

Specify optional pairs of arguments as Name1=Value1,...,NameN=ValueN, where Name is the argument name and Value is the corresponding value. Name-value arguments must appear after other arguments, but the order of the pairs does not matter.

Before R2021a, use commas to separate each name and value, and enclose Name in quotes.

Example: Window=hamming(256)

Note

The following name-value arguments apply if x is a time-domain signal. If x is a frequency-domain signal, name-value arguments are ignored.

Window applied in the time domain, specified as a real vector. The number of elements in the vector must be in the range [1, size(x,1)]. The number of elements in the vector must also be greater than OverlapLength.

Data Types: single | double

Number of samples overlapped between adjacent windows, specified as an integer in the range [0, size(Window,1)).

Data Types: single | double

Number of bins used to calculate the DFT of windowed input samples, specified as a positive scalar integer. If unspecified, FFTLength defaults to the number of elements in the Window.

Data Types: single | double

Frequency range in Hz, specified as a two-element row vector of increasing real values in the range [0, f/2].

Data Types: single | double

Spectrum type, specified as "power" or "magnitude":

  • "power" –– The spectral kurtosis is calculated for the one-sided power spectrum.

  • "magnitude" –– The spectral kurtosis is calculated for the one-sided magnitude spectrum.

Data Types: char | string

Output Arguments

collapse all

Spectral kurtosis, returned as a scalar, vector, or matrix. Each row of kurtosis corresponds to the spectral kurtosis of a window of x. Each column of kurtosis corresponds to an independent channel.

Spectral spread, returned as a scalar, vector, or matrix. Each row of spread corresponds to the spectral spread of a window of x. Each column of spread corresponds to an independent channel.

Spectral centroid in Hz, returned as a scalar, vector, or matrix. Each row of centroid corresponds to the spectral centroid of a window of x. Each column of centroid corresponds to an independent channel.

Algorithms

The spectral kurtosis is calculated as described in [1]:

kurtosis=k=b1b2(fkμ1)4sk(μ2)4k=b1b2sk

where

  • fk is the frequency in Hz corresponding to bin k.

  • sk is the spectral value at bin k.

  • b1 and b2 are the band edges, in bins, over which to calculate the spectral skewness.

  • μ1 is the spectral centroid, calculated as described by the spectralCentroid (Audio Toolbox) function.

  • μ2 is the spectral spread, calculated as described by the spectralSpread (Audio Toolbox) function.

References

[1] Peeters, G. "A Large Set of Audio Features for Sound Description (Similarity and Classification) in the CUIDADO Project." Technical Report; IRCAM: Paris, France, 2004.

Extended Capabilities

C/C++ Code Generation
Generate C and C++ code using MATLAB® Coder™.

GPU Arrays
Accelerate code by running on a graphics processing unit (GPU) using Parallel Computing Toolbox™.

Version History

Introduced in R2019a

See Also

(Audio Toolbox) | (Audio Toolbox) |

Topics