Statistica
RANK
84
of 301.950
REPUTAZIONE
1.790
CONTRIBUTI
0 Domande
371 Risposte
ACCETTAZIONE DELLE RISPOSTE
0.00%
VOTI RICEVUTI
476
RANK
5.432 of 21.471
REPUTAZIONE
239
VALUTAZIONE MEDIA
0.00
CONTRIBUTI
10 File
DOWNLOAD
13
ALL TIME DOWNLOAD
2397
RANK
of 177.647
CONTRIBUTI
0 Problemi
0 Soluzioni
PUNTEGGIO
0
NUMERO DI BADGE
0
CONTRIBUTI
43 Post
CONTRIBUTI
0 Pubblico Canali
VALUTAZIONE MEDIA
CONTRIBUTI
0 Punti principali
NUMERO MEDIO DI LIKE


Feeds
Pubblicato
Computer Graphics Years
I loved the question that Steve recently asked on his blog about what your earliest computer experiences were. It brought...
oltre 8 anni fa

Creating 3d slice plot from various 2d dot plots
So you have something like this: npts = 120; for i=1:10 years(i,:) = randi(50,[1 npts]); windows(i,:) = randn(...
circa 10 anni fa | 0
Better data tip for Polar graph
The new <http://www.mathworks.com/help/matlab/ref/polarplot.html polarplot function> in R2016a does this for you. <</matlabc...
circa 10 anni fa | 0
How to extract data point from a vector graphics by MATLAB?
The coordinates in the output file are not going to be the same as your data values. They can't be in some cases (e.g. YScale='l...
circa 10 anni fa | 0
Color a sphere surface/polar plot axis-wise
Something like this, perhaps? [x,y,z] = sphere(40); col(:,:,1) = abs(y); col(:,:,2) = abs(x); col(:,:,3) = abs(z);...
circa 10 anni fa | 1
how to pause mesh command?
As I explained in <http://blogs.mathworks.com/graphics/2015/06/09/object-creation-performance/ this post on the MATLAB Graphics ...
circa 10 anni fa | 0
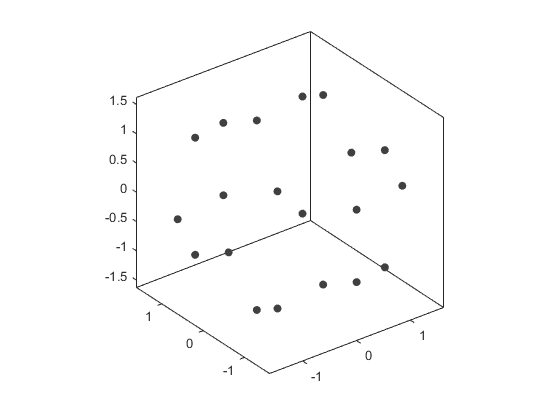
How can I create 2D projections from a 3D object?
One approach is the technique I showed in answers to <http://www.mathworks.com/matlabcentral/answers/258711-how-to-i-surf-or-3d-...
circa 10 anni fa | 1
Pubblicato
The Five Tetrahedra
The dodecahedron is a particularly interesting polyhedron. It's full of interesting five-fold symmetries. Let's take a look...
circa 10 anni fa
Bar graphs with two sets of different sizes
One simple way is this: none = length(one); ntwo = length(two); h = nan(max(none,ntwo),2); h(1:none,1)=one; h(1...
circa 10 anni fa | 0
| accettato
Cannot save opengl settings
I think that the "save" feature was added in R2014b. So you can't use it in R2014a. The simplest workaround would probably b...
circa 10 anni fa | 0
Handling axes as arguments
Axes only returns an axes handle in the cases where it is creating an axes object. The syntax where you pass an axes handle in i...
circa 10 anni fa | 0
how to set default properties for annotations
The pattern is * 'Default' * The value of the object's Type property * The name of the property you want to set. So, if...
circa 10 anni fa | 1
| accettato
May I ask how to do elliptic curve in matlab? because I have no idea to start...
Elliptic curves are examples of implicit curves. I discussed how to plot implicit curves in <http://blogs.mathworks.com/graphics...
circa 10 anni fa | 0
| accettato
How can I plot y-z plane slices in a 3D volume?
You don't really need to build a full 3D array and then slice it. You can just place individual 2D slices in a 3D axes. [y,...
circa 10 anni fa | 3
| accettato
contourf with fixed colormap
Try uncommenting the call to caxis and moving it after the call to contourf. It needs to be after the call to contourf because t...
circa 10 anni fa | 0
Computer freezes SOMETIMES when plotting
If it only happens when you plot, then the first suspect would be the driver for the graphics card. I would look to see whether ...
circa 10 anni fa | 0
Getting particular scatter plots
Something like this perhaps: hs = scatter(randn(1,1000),randn(1,1000),'.'); hr = rectangle('Position',[.5 .5 .65 .5]); ...
circa 10 anni fa | 0
How to convert a binary 3d matrix to mesh.
Yes, I would think that <http://www.mathworks.com/help/matlab/ref/isosurface.html isosurface> is the first thing to try. Just gi...
circa 10 anni fa | 2
| accettato
How to change the stem line color
That looks like the graphics driver bug which was discussed in <http://www.mathworks.com/matlabcentral/answers/275146-plot-lines...
circa 10 anni fa | 0
hObject, eventdata and handles not return double in R2016a
There was quite a bit of documentation on this as part of the R2014b release. <http://www.mathworks.com/help/matlab/graphics_tra...
circa 10 anni fa | 0
How to plot a triangular shape function on a triangular domain?
I described one approach in <http://www.mathworks.com/matlabcentral/answers/165073-please-help-me-to-program-of-this-equation-of...
circa 10 anni fa | 1
| accettato
how to plot a single valued function over a triangulated surface?
You can do it with patch. You'll just want to set FaceColor to interp and set the FaceVertexCData to to value of your function. ...
circa 10 anni fa | 1
| accettato
Problem with plotting on log scale - disappearing line on plot...
I'm guessing that xplot and yplot are 2 element vectors where one of the values is 0. In that case, one of the 2 points on the l...
circa 10 anni fa | 2
| accettato
2nd Y Axis problem - All works until I add the 2nd data set
I think that the problem is that the plot function resets a lot of the axes properties that you set when you created the 2nd axe...
circa 10 anni fa | 1
| accettato
Pubblicato
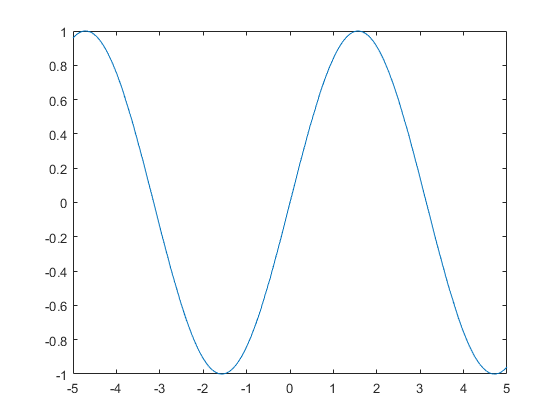
FPLOT and Friends
Another new feature that I really like in R2016a is the upgraded fplot function and all of the new members of the fplot...
circa 10 anni fa
matlab 2015 returns an empty graph
This code is creating 6,001 line objects which each have a single vertex. A line object with a single vertex is a degenerate cas...
circa 10 anni fa | 0
| accettato
3D plor plot
The <http://www.mathworks.com/help/matlab/ref/pol2cart.html pol2cart function> will convert this to 3D Cartesian, so it's easy t...
circa 10 anni fa | 1
| accettato
Showing only part of markers that overflow off the edges of a plot?
No there isn't a simple way to do that type of clipping with markers. In fact, you wouldn't believe how much work we do to get m...
circa 10 anni fa | 0
Draw stack order for yyaxis
I'm afraid that feature didn't make it into this initial release of yyaxis. As you've noted, the contents of the right side are ...
circa 10 anni fa | 1
Why is my default plot() showing up with gradient colors on the lines?
That looks a lot like <http://www.mathworks.com/matlabcentral/answers/275146-plot-lines-displaying-as-black-plus-gradient this i...
circa 10 anni fa | 0
| accettato