Adam Danz
MathWorks
Software engineer at MathWorks with a Ph.D. in neurophysiology from the University of Rochester (NY). Specialized in visual and vestibular systems, multisensory integration, sensory-motor and control systems, steering, and navigation. Former member of the MathWorks Community Advisory Board. *My community contributions before 14-Feb-2022 were prior to my employment at MathWorks.
He/him
Statistica
RANK
18
of 297.613
REPUTAZIONE
14.180
CONTRIBUTI
10 Domande
3.721 Risposte
ACCETTAZIONE DELLE RISPOSTE
80.0%
VOTI RICEVUTI
2.326
RANK
1.447 of 20.457
REPUTAZIONE
1.293
VALUTAZIONE MEDIA
4.80
CONTRIBUTI
28 File
DOWNLOAD
198
ALL TIME DOWNLOAD
34749
CONTRIBUTI
23 Post
CONTRIBUTI
0 Pubblico Canali
VALUTAZIONE MEDIA
CONTRIBUTI
31 Punti principali
NUMERO MEDIO DI LIKE
8


Feeds
Transparency violation error only in new desktop and when a breakpoint is set in another function.
Transparency in MATLAB code refers to MATLAB's ability to identify all variables by scanning the code while ignoring comments, c...
8 giorni fa | 0
| accettato
Pubblicato
Casting Shadows and Inverse Stereographic Projections
Guest Writer: Eric Ludlam Joining us again is Eric Ludlam, development manager of the MATLAB charting team....
8 giorni fa

The plotting function implicit3 fails to render under certain conditions. Notably, for sphere larger than a certain amount.
I believe the problem is recreated when the axes limits are not set. In this case, the ImplicitFunctionSurface is larger than th...
9 giorni fa | 0
"plot" versus "text" command
Text's property AffectAutoLimits is set to off by default. This means that the axes limits will not update if a text object is ...
13 giorni fa | 2
| accettato
Pubblicato
Casting Shadows
Guest Writer: Eric Ludlam Joining us again is Eric Ludlam, development manager of the MATLAB charting team....
16 giorni fa
Converting from Cartesian rates to spherical rates.
To convert the three Cartesian velocity components to spherical velocity values, you can follow these steps. I assume East is ...
20 giorni fa | 0
Implementation details on surfnorm()
I recently looked into this topic and here's what I found. The surfnorm algorithm uses bicubic interpolation as defined in the...
20 giorni fa | 0
How do I make and export a brushed area from a figure
Turn on brushing To turn on brushing, press the brush icon in the axes toolbar or called the brush command: brush on. Intera...
23 giorni fa | 0
Alphabetical Sorting (case insensitive)
> I want to assort an array of words in alphabetical order with case insensitive sorting A = ["help" ; "MATLAB" ; "anyTIME" ; "...
26 giorni fa | 0

Poll
Which skill would you like to enhance: Creating or Interpreting data visualizations?
29 giorni fa | 28 votes | 2 comments
Appdesigner: updating the value of Text area
See drawnow function StartButtonPushed(app, event) app.val = app.PromptTextArea.Value; app.StartButton.Enable = "of...
circa un mese fa | 0
| accettato
Replacement for undocumented function feature('setround')
> Is there a documented MATLAB replacement for the undocumented function feature(‘setround’)? There currently is not a document...
circa un mese fa | 0
| accettato
Alias blanks in the cell array as a string.
As the OP found, the solution is to include multiple delimiters strsplit(t,'\t', 'CollapseDelimiters',false) And as others hav...
circa 2 mesi fa | 1
| accettato
Group Data for one Legend in Figure of Multiple SubPlots
Here are the key concepts to achieve this Use tiledlayout instead of subplot. Tiledlayout does a much better job at hosting gl...
circa 2 mesi fa | 1
| accettato
How to read numeric data with different number of columns
Is this what you are looking for? file = "data.txt"; t = readtable(file, 'ReadRowNames',true,"Delimiter",'\t') The data file...
circa 2 mesi fa | 0
| accettato
Understand values differences between smooth and smoothdata functions
> Is there a difference in window calculation between smooth and smoothdata for 'lowess' method These two functions compute the...
circa 2 mesi fa | 1
Unable to see uifigure object properties
Let's see if I understand your workflow. Please correct me if this summary is incorrect. rbBar and rbLine are defined in a fun...
circa 2 mesi fa | 0
Remove NaNs from uitable Matlab App
Can a UITable show missing values or NaNs as empty? Currently there is not an option to show missing or NaN values as empty in ...
circa 2 mesi fa | 1
| accettato
Pubblicato
Violin Plot: A Tool For Visualizing Distributions
Guest Writer: Baldvin Einarsson Baldvin is a software engineer in the Statistics and Machine Learning...
2 mesi fa

how to add geoplot scatter plot custom icon overlays?
If you're using MATLAB R2024b or later and have the Mapping Toolbox, use the new geoiconchart. lat = [37.7749, 34.0522, 40.7128...
2 mesi fa | 2
How to rotate rectangular with a an angle?
MATLAB's polyshape has a rotate function that makes this fairly easy. Instead of the [left, bottom, width, height] input used i...
2 mesi fa | 1
Superscripts and subscripts in fprintf
Not all letters have unicode subscripts but m, a, and x do, so you're in luck. x = 2; fprintf(1,'Maximum value of N is N%c%c%...
3 mesi fa | 0
how to halt a for loop in an external function called from mlapp by using a stop button in the mlap app
> Do I need to pass in app.stopFlag as an argument with the function when I call it, I thought that making app.stopFlag public w...
3 mesi fa | 0
Zoom of image on UIAxes seems to have one axis bound
Try setting the DataAspectRatio to [1 1 1] using axis(uiax,'equal'). If that doesn't fix the issue, it would help to share a ...
3 mesi fa | 0
| accettato
How to disable or delete cameratoolbar context menu
This stumped me for a bit but I've found a potential workaround. I'll also make a note of this issue for discussion. Workaroun...
3 mesi fa | 0
Why is bootci giving different interval than prctile?
You're using two different alpha values. When you call bootci, you specify alpha as 0.05 or 5%. When you call prctile, you'...
3 mesi fa | 1
| accettato
What are All of the Variables in the Workspace on Answers?
Fixed! Thanks for reporting it. myvar = 5; whos
3 mesi fa | 2
| accettato
Pubblicato
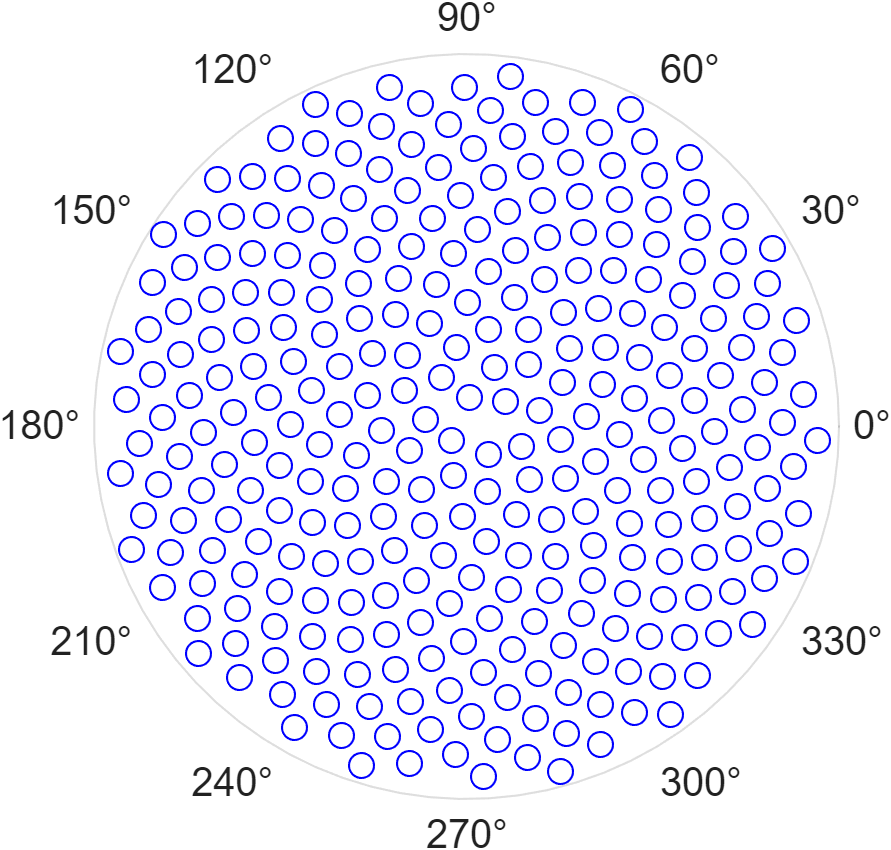
Pinecode: Creating pinecones with Fibonacci spirals
Today we explore phyllotactic spirals, a naturally emerging pattern found in densely packed plant structures such as...
3 mesi fa
Copy/Paste from ListBox at runtime
Add a right-click "copy" option to ListBox Create a context menu for the list box and set its MenuSelectedFcn to use clipboard...
3 mesi fa | 1
| accettato
Pubblicato
Share your Apps with MATLAB Online and Focused View: A Pumpkin Example
Guest Writer: Eric Ludlam Today Eric Ludlam shares three steps to share your app with others using a hyperlink....
4 mesi fa
Seleziona un sito web
Seleziona un sito web per visualizzare contenuto tradotto dove disponibile e vedere eventi e offerte locali. In base alla tua area geografica, ti consigliamo di selezionare: United States.
Puoi anche selezionare un sito web dal seguente elenco:
Americhe
- América Latina (Español)
- Canada (English)
- United States (English)
Europa
- Belgium (English)
- Denmark (English)
- Deutschland (Deutsch)
- España (Español)
- Finland (English)
- France (Français)
- Ireland (English)
- Italia (Italiano)
- Luxembourg (English)
- Netherlands (English)
- Norway (English)
- Österreich (Deutsch)
- Portugal (English)
- Sweden (English)
- Switzerland
- United Kingdom (English)