Interactively Analyze Telemetry Data with the Flight Log Analyzer App
The Flight Log Analyzer app, provided with UAV Toolbox, is designed to help UAV users and developers test and review their system performance. Learn how to quickly load ULOG, TLOG, or custom flight logs; display data for analysis; and generate actionable results. See how to display a map view of the flight that provides a view of the UAV flight path, and how to save and share the figures generated and sessions created.
Published: 12 Nov 2020
Flight Log Analyzer app, provided with the UAV Toolbox, is designed to help UAV developers and UAV users to test and review their system performance.
It enables you to quickly load flight logs, display data you would like to analyze, and generate actionable results.
To run the app, you can open it from the “APPS” tab, or run it from the command window by entering “flightLogAnalyzer”
Import a log file by clicking on “Import”.
The app supports ulog, tlog, and custom formats by default.
In this video, we load a simulated log file.
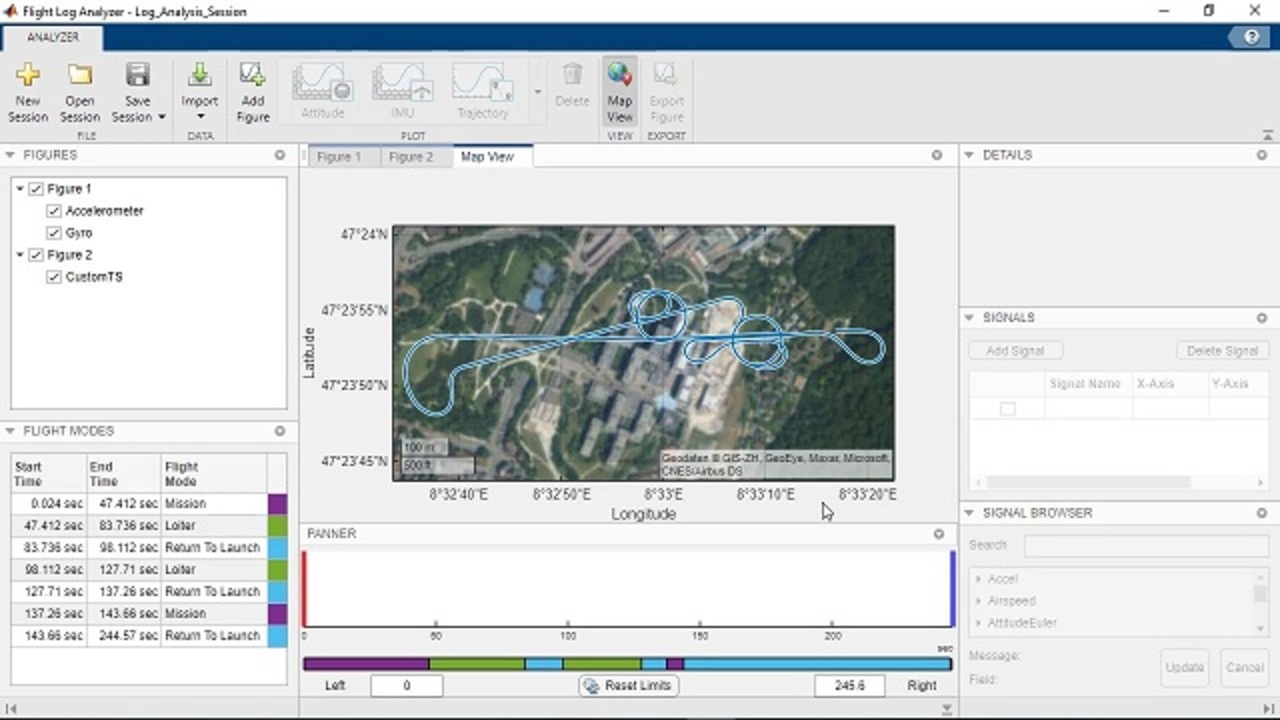
On loading the log file, the app automatically displays the map view which provides a view of the UAV flight path.
Toggle the map view on or off using the “Map View” button.
We can pan the view and zoom in to look at the takeoff location. To reset the map view, click on the home icon.
To analyze the data from the log file, you can create a figure by clicking on “add figure”, and add plots to the figure from the “Plot” dropdown list.
For example, to look at the acceleration forces during landing, add the IMU and Height plots and look at the accelerometer plot.
To focus on the acceleration spike in the landing data segment, select the Accelerometer plot to display it in the panner, and move the handles to the landing data segment.
We can reset the handles by clicking on “Reset Limits”.
The list of figures and plots created are shown on the left in the “Figures” pane.
To remove specific plots or figures, such as the height plot, select it and click on “delete”
The “Flight Modes” section displays various flight modes used during the flight.
The flight modes are also shown at the bottom of the panner identifying the time periods they are active.
Next, let’s look at how the estimated roll follows the roll target using custom plots. For this, we create a new figure and select a “Custom Timeseries plot”.
To add these 2 signals, click on “Add signal” twice. From the signals, select the first signal by double clicking on it’s Y-axis and from the signal browser, select “RollTarget” and click “update”. For the second signal follow the same steps and select “Roll”.
The plot shows the estimated roll following the roll target.
Now that you have the necessary plots , you can save them using the “Export Figure” Option.
To save the session and all the figures created, use “Save session”.
Saving a session allows you to share it with others in your team who also use the flight Log Analyzer app enabling further analysis.
For creating custom log formats, please refer to the “Visualize Custom Flight Log” Example.
For more information, please refer to the help section on “Flight Log Analyzer” in the UAV Toolbox documentation.


