Hand Gesture Classification Using Radar Signals and Deep Learning
This example shows how to classify ultra-wideband (UWB) impulse radar signal data using a multiple-input, single-output convolutional neural network (CNN).
Introduction
Movement-based signal data acquired using sensors, like UWB impulse radars, contain patterns specific to different gestures. Correlating motion data with movement benefits several avenues of work. For example, hand gesture recognition is important for contactless human-computer interaction. This example aims to use a deep learning solution to automate feature extraction from patterns within a hand gesture dataset and provide a label for every signal sample.
UWB-gestures is a publicly available dataset of dynamic hand gestures [1]. It contains a total of 9600 samples gathered from eight different human volunteers. To obtain each recording, the examiners placed a separate UWB impulse radar at the left, top, and right sides of their experimental setup, resulting in three received radar signal data matrices. Volunteers performed hand gestures from a gesture vocabulary consisting of 12 dynamic hand movements:
Left-right swipe (L-R swipe)
Right-left swipe (R-L swipe)
Up-down swipe (U-D swipe)
Down-up swipe (D-U swipe)
Diagonal-left-right-up-down swipe (Diag-LR-UD swipe)
Diagonal-left-right-down-up swipe (Diag-LR-DU swipe)
Diagonal-right-left-up-down swipe (Diag-RL-UD swipe)
Diagonal-right-left-down-up swipe (Diag-RL-DU swipe)
Clockwise rotation
Counterclockwise rotation
Inward push
Empty gesture
As each hand gesture motion is captured by three independent UWB impulse radars, we will use a CNN architecture that accepts three signals as separate inputs. The CNN model will extract feature information from each signal before combining it to make a final gesture label prediction. As such, a multiple-input, single-output CNN will use minimally pre-processed radar signal data matrices to classify different gestures.
Download the Data
Each radar signal data matrix is labeled as the hand gesture that generated it. 8 different human volunteers performed 12 separate hand gestures, for a total of 96 trials stored in 96 MAT files. Each MAT file contains 3 radar data matrices, corresponding to the three radars used in the experimental setup. They are named Left, Top, and Right. The files are available at the following location:
https://ssd.mathworks.com/supportfiles/SPT/data/uwb-gestures.zip
Download the data files into your MATLAB Examples directory.
datasetZipFolder = matlab.internal.examples.downloadSupportFile("SPT/data","uwb-gestures.zip");
datasetFolder = erase(datasetZipFolder,".zip");
if ~exist(datasetFolder,"dir")
    downloadLocation = fileparts(datasetZipFolder);
    unzip(datasetZipFolder,downloadLocation);
end
You can also choose to download a separate file which includes a pre-trained network, misoNet, stored in a MAT file named pretrainedNetwork.mat. It is available at the following location:
https://ssd.mathworks.com/supportfiles/SPT/data/uwb-gestures-network.zip
You can skip the training steps and use the pre-trained network for classification by setting doTraining to false. If doTraining is set to false, the pre-trained network will be downloaded later in this example. If you want to train the network as the example runs, make sure to set doTraining to true.
doTraining = true;
Explore the Data
Create a signal datastore to access the data in the files. Specify the signal variable names you want to read from each file using the SignalVariableNames parameter. This example assumes the dataset has been stored in your MATLAB Examples directory under the uwb-gestures folder. If this is not the case, change the path to the data in the datasetFolder variable.
sds = signalDatastore(datasetFolder,...
                      "IncludeSubfolders",true,...
                      "SignalVariableNames",["Left","Top","Right"],...
                      "FileExtensions",".mat",...
                      "ReadOutputOrientation","row");
The datastore returns a three-element cell array containing the radar signal matrices for the left, top, and right radars, in that order.
preview(sds)
ans=1×3 cell array
    9000×189 double    9000×189 double    9000×189 double
The rows and columns in each radar signal matrix represent the duration of the hand gesture (slow-time) and the distance of the hand from the radar (fast-time), respectively. During data acquisition, examiners recorded a subject repeating a particular hand gesture for 450 seconds, corresponding to 9000 (slow-time) rows. There is 1 complete gesture motion in 90 slow-time frames. As such, each radar signal matrix contains 100 complete hand gesture motion samples. The range of each UWB radar is 1.2 meters, corresponding to 189 fast-time bins.
slowTimeFrames = 90;
recordedTimePerSample = 4.5;
radarRange = 1.2;
To visualize a hand gesture motion, specify a UWB radar location, gesture, and gesture sample (between 1 and 100).
radarToPlot =1; gestureToPlot =
"_G1_"; gestureSample =
50;

Obtain the radar signal matrix for the chosen hand gesture and radar location.
sdssubset = subset(sds,contains(sds.Files,gestureToPlot));
radarDataMatrix = read(sdssubset);
radarDataMatrix = radarDataMatrix{radarToPlot};
Use normalize to transform the gesture signal data to range between 0 and 1, and use imagesc to visualize the hand gesture motion sample.
normalizedRadarData = normalize(radarDataMatrix,2,"range",[0 1]);
imagesc([0 radarRange],...
        [0 recordedTimePerSample],...
        normalizedRadarData( ...
        slowTimeFrames*(gestureSample-1)+1:slowTimeFrames*gestureSample,:), ...
        [0 1]);
set(gca,"YDir","normal")
title("Raw Signal")
xlabel("Distance of Hand from the Radar (m)")
ylabel("Duration of Hand Gesture (s)")

As you can see, it is difficult to discern a motion pattern.
The raw signal contains environmental reflections from body parts or other static objects present within the radar's range. These unwanted reflections are known as "clutter" and can be removed using a pulse canceler that performs an exponential moving average. The transfer function for this operation is
such that is a value that controls the amount of averaging [2]. Use filter with the numerator coefficients and denominator coefficients set as [1 -1] and [1 -0.9], respectively, to remove clutter from the raw signal.
clutterRemovedSignal = filter([1 -1],[1 -0.9],radarDataMatrix,[],1);
Visualize the clutter-removed signal to see the difference.
normalizedClutterRemovedSignal = normalize(clutterRemovedSignal,2,"range",[0 1]);
imagesc([0 radarRange],...
        [0 recordedTimePerSample],...
        normalizedClutterRemovedSignal( ...
        slowTimeFrames*(gestureSample-1)+1:slowTimeFrames*gestureSample,:),...
        [0 1]);
set(gca,"YDir","normal")
title("Clutter-Removed Signal")
xlabel("Distance of Hand from the Radar (m)")
ylabel("Duration of Hand Gesture (s)")
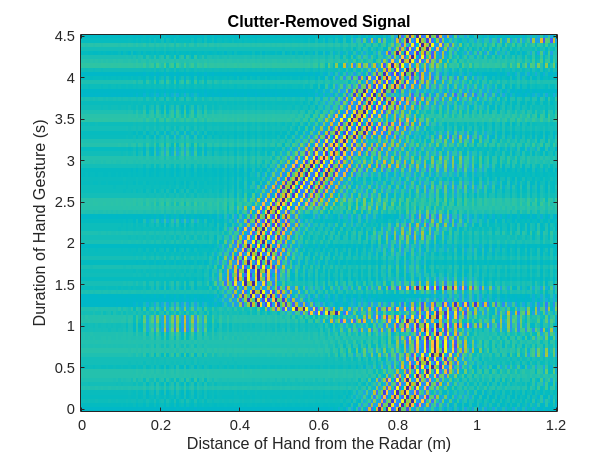
Note that the motion pattern is much more visible now. For example, if you choose to visualize a left-right swipe from the perspective of the left radar, you will see that the distance of the hand from the radar increases over the duration of the hand gesture.
Prepare Data for Training
The MAT file names contain gesture codes (G1, G2,..., G12) corresponding to labels for each radar signal matrix. Convert these codes to labels within the gesture vocabulary, using a categorical array.
[~,filenames] = fileparts(sds.Files);
gestureLabels = extract(filenames,"G"+digitsPattern);
gestureCodes = ["G1","G2","G3","G4",...
                "G5","G6","G7","G8",...
                "G9","G10","G11","G12"];
gestureVocabulary = ["L-R swipe"        "R-L swipe" ...
                     "U-D swipe"        "D-U swipe" ...
                     "Diag-LR-UD swipe" "Diag-LR-DU swipe" ...
                     "Diag-RL-UD swipe" "Diag-RL-DU swipe" ...
                     "clockwise"        "counterclockwise" ...
                     "inward push"      "empty"];
gestureLabels = categorical(gestureLabels,gestureCodes,gestureVocabulary);
Collect the labels in an array datastore.
labelDs = arrayDatastore(gestureLabels,"OutputType","cell");
Combine the signal datastore and array datastore to obtain a single datastore that contains the signal data from each radar and a categorical label. Shuffle the resulting datastore to randomize the order in which it stores the MAT files.
allDataDs = combine(sds,labelDs);
allDataDs = shuffle(allDataDs);
preview(allDataDs)
ans=1×4 cell array
    9000×189 double    9000×189 double    9000×189 double    L-R swipe
The transform function allows the helper function, processData, to be applied to data as it is read by a datastore. processData performs the normalization and filtering that was described in the above section to standardize data and remove clutter. In addition, it divides the radar signal matrix into separate hand gesture motion samples.
allDataDs = transform(allDataDs,@processData);
preview(allDataDs)
ans=8×4 cell array
    90×189 double    90×189 double    90×189 double    L-R swipe
    90×189 double    90×189 double    90×189 double    L-R swipe
    90×189 double    90×189 double    90×189 double    L-R swipe
    90×189 double    90×189 double    90×189 double    L-R swipe
    90×189 double    90×189 double    90×189 double    L-R swipe
    90×189 double    90×189 double    90×189 double    L-R swipe
    90×189 double    90×189 double    90×189 double    L-R swipe
    90×189 double    90×189 double    90×189 double    L-R swipe
Neural network training is iterative. At every iteration, the datastore reads data from files and transforms the data before updating the network coefficients. Since the data is being read from individual samples, the data will need to be read into memory, before being re-shuffled and inserted into another datastore for training.
Because the entire training dataset fits in memory, it is possible to transform the data in parallel, if Parallel Computing Toolbox is available, and then gather it into the workspace. Use readall with the UseParallel flag set to true to utilize a parallel pool to read all of the signal data and labels into the workspace. If the data fits into the memory of your computer, importing the data into the workspace enables faster training because the data is read and transformed only once. Note that if the data does not fit in memory, you must to pass the datastore into the training function, and the transformations are performed at every training epoch.
allData = readall(allDataDs,"UseParallel",true);Starting parallel pool (parpool) using the 'Processes' profile ... Connected to parallel pool with 8 workers.
The labels are returned as the last column in allData. Use countlabels to obtain proportions of label values in the dataset. Note that the gestures are balanced and well-represented across the dataset.
countlabels(allData(:,4))
ans=12×3 table
           D-U swipe    793    8.2664
    Diag-LR-DU swipe    800    8.3394
    Diag-LR-UD swipe    800    8.3394
    Diag-RL-DU swipe    800    8.3394
    Diag-RL-UD swipe    800    8.3394
           L-R swipe    800    8.3394
           R-L swipe    800    8.3394
           U-D swipe    800    8.3394
           clockwise    800    8.3394
    counterclockwise    800    8.3394
               empty    800    8.3394
         inward push    800    8.3394
Divide the data randomly into training and validation sets, while making sure to leave testing data for later. In this example, training, validation, and testing splits will be 70%, 15%, and 15%, respectively. Use splitlabels to split the data into training, validation, and testing sets that maintain the same label proportions as the original dataset. Specify the randomized option to shuffle the data randomly across the three sets.
idxs = splitlabels(allData(:,4),[0.7 0.15],"randomized");
trainIdx = idxs{1}; valIdx = idxs{2}; testIdx = idxs{3};
Avoid selecting samples from the same trial by randomizing the indices once more. Store the in-memory training and validation data in array datastores so that they can be used to train a multi-input network.
trainData = allData(trainIdx(randperm(length(trainIdx))),:);
valData = allData(valIdx(randperm(length(valIdx))),:);
trainDataDs = arrayDatastore(trainData,"OutputType","same");
valDataDs = arrayDatastore(valData,"OutputType","same");
Prepare Network for Training
Define the network architecture before training. Since each hand gesture motion is captured by 3 independent UWB impulse radars, we will use a CNN architecture that accepts 3 signals as separate inputs. The results achieved after training this proposed multiple-input, single-output CNN are considerably better than those achieved with an alternative single-input, single-output CNN whose input is a 90 x 189 x 3 stack of radar data matrices.
repeatBranch contains operations that will be performed separately on the three radar data signal matrices. The CNN model needs to combine the extracted feature information from each signal to make a final gesture label prediction. mainBranch contains operations that will concatenate the 3 repeatBranch outputs and estimate labels. Specify an imageInputLayer of size 90 x 189 to accept the hand gesture motion samples. Specify an additionLayer with number of inputs set to 3, to collect the outputs of the 3 branches and pass them into the classification section of the model. Specify a fullyConnectedLayer with an output size of 12, one for each of the hand gestures. Add a softmaxLayer to output the estimated probability, also known as prediction scores, for each category.
repeatBranch = [
    imageInputLayer([90 189 1],"Normalization", "none")

    convolution2dLayer(3,8,"Padding",1)
    batchNormalizationLayer
    reluLayer
    maxPooling2dLayer(2,"Stride",2)

    convolution2dLayer(3,16,"Padding",1)
    batchNormalizationLayer
    reluLayer
    maxPooling2dLayer(2,"Stride",2)

    convolution2dLayer(3,32,"Padding",1)
    batchNormalizationLayer
    reluLayer
    maxPooling2dLayer(2,"Stride",2)

    convolution2dLayer(3,64,"Padding",1)
    batchNormalizationLayer
    reluLayer
    maxPooling2dLayer(2,"Stride",2)];

mainBranch = [
    additionLayer(3)
    fullyConnectedLayer(12)
    softmaxLayer
    ];
Define a dlnetwork to which repeatBranch is added 3 times and mainBranch is added once. Connect the outputs of the final maxPooling2dLayer in each repeatBranch to the inputs of additionLayer.
misoCNN = dlnetwork();
misoCNN = addLayers(misoCNN, repeatBranch);
misoCNN = addLayers(misoCNN, repeatBranch);
misoCNN = addLayers(misoCNN, repeatBranch);
misoCNN = addLayers(misoCNN, mainBranch);
misoCNN = connectLayers(misoCNN, "maxpool_4", "addition/in1");
misoCNN = connectLayers(misoCNN, "maxpool_8", "addition/in2");
misoCNN = connectLayers(misoCNN, "maxpool_12", "addition/in3");
Visualize the multiple-input, single-output CNN.
plot(misoCNN);

Choose options for the training process that ensure good network performance. Make sure to specify valDataDs as ValidationData, so that it is used for validation during training. Refer to the trainingOptions (Deep Learning Toolbox) documentation for a description of each parameter.
options = trainingOptions("adam", ...
    "InitialLearnRate",5e-4, ...
    "MaxEpochs",3,...
    "MiniBatchSize",32, ...
    "ValidationData",valDataDs, ...
    "ValidationFrequency",40, ...
    "Verbose",false, ...
    "Plots","training-progress", ...
    "Metrics","accuracy");
Train Network
Use the trainnet (Deep Learning Toolbox) command to train the CNN. For classification, use cross-entropy loss.
if doTraining == true
    misoNet = trainnet(trainDataDs,misoCNN,"crossentropy",options);
else
    pretrainedNetworkZipFolder = matlab.internal.examples.downloadSupportFile("SPT","data/uwb-gestures-network.zip");
    pretrainedNetworkFolder = erase(pretrainedNetworkZipFolder,".zip");
    if ~exist(pretrainedNetworkFolder,"dir")
        downloadLocation = fileparts(pretrainedNetworkZipFolder);
        unzip(pretrainedNetworkZipFolder,downloadLocation);
    end
    load(fullfile(pretrainedNetworkFolder,"pretrainedNetwork.mat"),"misoNet");
    misoNet = dag2dlnetwork(misoNet);
end

Classify Testing Data
Classify the testing data using the trained CNN. To make predictions with multiple observations, use the minibatchpredict (Deep Learning Toolbox) function. To convert the prediction scores to labels, use the scores2label function. The minibatchpredict function automatically uses a GPU if one is available. Using a GPU requires a Parallel Computing Toolbox™ license and a supported GPU device. For information on supported devices, see GPU Computing Requirements (Parallel Computing Toolbox). Otherwise, the function uses the CPU.
testData = allData(testIdx,:);
testData = {cat(4,testData{:,1}),cat(4,testData{:,2}), ...
            cat(4,testData{:,3}),cat(1,testData{:,4})};
actualLabels = testData{4};
classNames = categories(actualLabels);
scores = minibatchpredict(misoNet,testData{1},testData{2},testData{3});
predictedLabels = scores2label(scores,classNames);
accuracy = mean(predictedLabels==actualLabels);
fprintf("Accuracy on the test set is %0.2f%%",100*accuracy)
Accuracy on the test set is 97.22%
Visualize classification performance using a confusion matrix.
confusionchart(predictedLabels,actualLabels);

The largest confusion is between counterclockwise and clockwise movements and inward push and empty movements.
Explore Network Predictions
You can obtain the scores from the final max-pooling layers in each input branch to get a better understanding of how data from each radar contributed to final network confidence. The helper function, getActivationData, returns softmax-normalized scores (probabilities for class membership) and indices corresponding to the 3 highest scores.
gestureToPlot ="L-R swipe"; gestureToPlotIndices = find(matches(string(actualLabels),gestureToPlot)); gestureSelection = randsample(gestureToPlotIndices,1); actualLabel = actualLabels(gestureSelection); predictedLabel = predictedLabels(gestureSelection); allLabels = categories(actualLabels); [leftScores, leftClassIds] = getActivationData( ... misoNet,testData,gestureSelection,"maxpool_4"); [topScores, topClassIds] = getActivationData( ... misoNet,testData,gestureSelection,"maxpool_8"); [rightScores, rightClassIds] = getActivationData( ... misoNet,testData,gestureSelection,"maxpool_12");
Use the helper function plotActivationData to visualize the data from each radar and overlay the labels corresponding to the 3 highest scores after the operations in each input branch are completed.
t = tiledlayout(1,3);
plotActivationData(testData, allLabels, leftScores, leftClassIds,...
    gestureSelection, [0 radarRange],[0 recordedTimePerSample], "Left");
plotActivationData(testData, allLabels, topScores, topClassIds,...
    gestureSelection, [0 radarRange],[0 recordedTimePerSample], "Top");
plotActivationData(testData, allLabels, rightScores, rightClassIds,...
    gestureSelection, [0 radarRange],[0 recordedTimePerSample], "Right");
title(t,["Actual Label : "+string(actualLabel); ...
    "Predicted Label : "+string(predictedLabel)],"FontSize",12);
xlabel(t,"Distance of Hand from the Radar (m)","FontSize",11)
ylabel(t,"Duration of Hand Gesture (s)","FontSize",11)

Conclusion
In this example, you learned how to use a multiple-input CNN to extract information from 3 independent radar data matrices and classify hand gesture movements. The multiple-input architecture allowed us to take advantage of data generated by multiple sensors recording the same event.
Helper Functions
function dataOut = processData(dataIn)
    label = dataIn(end);
    dataIn(end) = [];
    dataOut = cellfun(@(x) filter([1 -1],[1 -0.9],x,[],1), ...
                           dataIn,"UniformOutput",false);
    dataOut = cellfun(@(x) normalize(x,2,"range",[0 1]), ...
                           dataOut,"UniformOutput",false);
    dataOut = cat(1,dataOut{:});
    dataOut = mat2cell(dataOut,90*ones(1,size(dataOut,1)/90));
    dataOut = reshape(dataOut,[],3);
    dataOut(:,4) = label;
end

function [scores, classIds] = getActivationData(net, testData, index, layer)
    activation = predict(net, ...
                        testData{1}(:,:,index),testData{2}(:,:,index), ...
                        testData{3}(:,:,index),Outputs=layer);
    fcWeights = net.Layers(end-1).Weights;
    fcBias = net.Layers(end-1).Bias;
    scores = fcWeights*activation(:) + fcBias;
    scores = exp(scores)/sum(exp(scores));
    [~,classIds] = maxk(scores,3);
end

function plotActivationData(testData, labels, scores, ids, ...
                            sampleIdx, xlimits, ylimits, plotTitle)
    if plotTitle == "Left"
        gesture = 1;
    elseif plotTitle == "Top"
        gesture = 2;
    elseif plotTitle == "Right"
        gesture = 3;
    end
    nexttile;
    imagesc(xlimits,ylimits,testData{gesture}(:,:,sampleIdx),[0 1])
    text(0.3,4,plotTitle,"Color","red", ...
        "FontWeight","bold","HorizontalAlignment","center")
    set(gca,"YDir","normal")
    title(string(labels(ids)) + ": " ...
        + string(round(scores(ids),3)),"FontSize",8);
end
References
[1] Ahmed, S., Wang, D., Park, J. et al. UWB-gestures, a public dataset of dynamic hand gestures acquired using impulse radar sensors. Sci Data 8, 102 (2021). https://doi.org/10.1038/s41597-021-00876-0.
[2] Lazaro A, Girbau D, Villarino R. Techniques for clutter suppression in the presence of body movements during the detection of respiratory activity through UWB radars. Sensors (Basel, Switzerland). 2014 Feb;14(2):2595-2618. DOI: 10.3390/s140202595.
See Also
arrayDatastore | signalDatastore | splitlabels | trainnet (Deep Learning Toolbox)