boundary
Piecewise distribution boundaries
Description
Examples
Generate a sample data set and create a paretotails object by fitting a piecewise distribution with Pareto tails to the generated data. Find the boundary points between segments in a paretotails object by using the object function boundary.
Generate a sample data set containing 20% outliers.
rng('default');  % For reproducibility
left_tail = -exprnd(1,100,1);
right_tail = exprnd(5,100,1);
center = randn(800,1);
x = [left_tail;center;right_tail];
Create a paretotails object by fitting a piecewise distribution to x. Specify the boundaries of the tails using the lower and upper tail cumulative probabilities so that a fitted object consists of the empirical distribution for the middle 80% of the data set and generalized Pareto distributions (GPDs) for the lower and upper 10% of the data set.
pd = paretotails(x,0.1,0.9)
pd =
Piecewise distribution with 3 segments
      -Inf < x < -1.33251    (0 < p < 0.1): lower tail, GPD(-0.0063504,0.567017)
   -1.33251 < x < 1.80149  (0.1 < p < 0.9): interpolated empirical cdf
        1.80149 < x < Inf    (0.9 < p < 1): upper tail, GPD(0.24874,3.00974)
Return the boundary values between the piecewise segments by using the boundary function.
[p,q] = boundary(pd)
p = 2×1

    0.1000
    0.9000
q = 2×1

   -1.3325
    1.8015
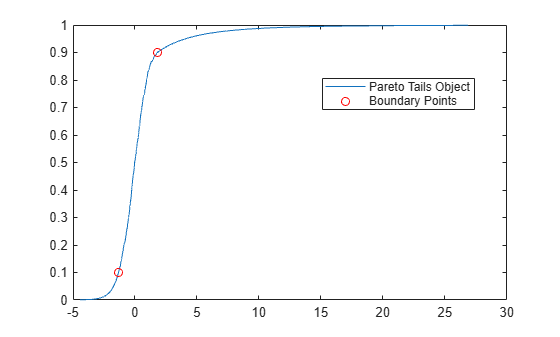
The values in p are the cumulative probabilities at the boundaries, and the values in q are the corresponding quantiles.
Plot the cdf of the paretotails object and mark the boundary points on the figure.
xi = sort(x);
plot(xi,cdf(pd,xi))
hold on
plot(q,p,'ro')
legend('Pareto Tails Object','Boundary Points','Location','best')
hold off
Input Arguments
Output Arguments
Version History
Introduced in R2007a