Mettiti comodo!
Discussions è il tuo spazio in cui puoi conoscere i tuoi colleghi, affrontare insieme le sfide più grandi e divertirti.
- Vuoi vedere gli ultimi aggiornamenti? Segui i punti salienti!
- Cerchi tecniche per migliorare le tue competenze in MATLAB o Simulink? Tips & Tricks è la soluzione che fa per te!
- Vuoi condividere la barzelletta, il gioco di parole o il meme matematico perfetto? Non cercare altro che il divertimento!
- Pensi che ci sia un canale di cui abbiamo bisogno? Raccontaci di più in Ideas
Discussions aggiornate
Short version: MathWorks have released the MATLAB Agentic Toolkit which will significantly improve the life of anyone who is using MATLAB and Simulink with agentic AI systems such as Claude Code or OpenAI Codex. Go and get it from here: https://github.com/matlab/matlab-agentic-toolkit
Long version: On The MATLAB Blog Introducing the MATLAB Agentic Toolkit » The MATLAB Blog - MATLAB & Simulink
MATLAB EXPO India | 7 May | Bengaluru
Get inspired by the latest trends and real-world customer success stories transforming industries. Learn from trusted experts across 4 tracks.
- AI & Autonomous Systems
- Electrification
- Systems & Software Engineering
- Radar, Wireless & HDL
Register at bit.ly/matlabexpocommunity

Do we know if MATLAB is being used on the Artemis II (moon mission) spacecraft itself? Like is the crew running MATLAB programs? I imagine it was probably at least used in development of some of the components of the spacecraft, rockets, or launch building. Or is it used for any of the image analysis of the images collected by the spacecraft?
Overview
Authors:
- Narayanaswamy P.R. Iyer
- Provides Simulink models for various PWM techniques used for inverters
- Presents vector and direct torque control of inverter-fed AC drives and fuzzy logic control of converter-fed AC drives
- Includes examples, case studies, source codes of models, and model projects from all the chapters.
About this book
Successful development of power electronic converters and converter-fed electric drives involves system modeling, analyzing the output voltage, current, electromagnetic torque, and machine speed, and making necessary design changes before hardware implementation. Inverters and AC Drives: Control, Modeling, and Simulation Using Simulink offers readers Simulink models for single, multi-triangle carrier, selective harmonic elimination, and space vector PWM techniques for three-phase two-level, multi-level (including modular multi-level), Z-source, Quasi Z-source, switched inductor, switched capacitor and diode assisted extended boost inverters, six-step inverter-fed permanent magnet synchronous motor (PMSM), brushless DC motor (BLDCM) and induction motor (IM) drives, vector-controlled PMSM, IM drives, direct torque-controlled inverter-fed IM drives, and fuzzy logic controlled converter-fed AC drives with several examples and case studies. Appendices in the book include source codes for all relevant models, model projects, and answers to selected model projects from all chapters.
This textbook will be a valuable resource for upper-level undergraduate and graduate students in electrical and electronics engineering, power electronics, and AC drives. It is also a hands-on reference for practicing engineers and researchers in these areas.
Hi all,
I'm a UX researcher here at MathWorks working on the MathWorks Central Community. We're testing a new feature to make it easier to ask a question, and we'd love to hear from community members like you.
Sessions will be next week. They are remote, up to 2 hours (often shorter), and participants receive a $100 stipend. If you're interested, you can click here to schedule.
Thanks in advance! Your feedback directly shapes what gets built.
--David, MathWorks UX Research
MATLAB interprets the first block of uninterupted comments in a function file as documentation. Consider a simple example.
% myfunc This is my function
%
% See also sin
function z = myfunc(x, y)
z = x + y;
end
Those comments are printed in the command window with "help myfunc" and displayed in a separate window with "doc myfunc". A lot of useful things happen behind the scenes as well.
- Hyperlinks are automatically added for valid file names after "See also".
- When dealing with classes, the doc command automatically appends the comment block with a lists of properties and methods.
All this is very handy and as been around for quite some time. However, the doc browser isn't great (forward/back feature was removed several versons ago), the text formatting isn't great, and there is no way to display math.
Although pretty text/math can be displayed in a live document, the traditional *.mlx file format does not always play nice with Git and I have avoided them. However, live documents can now (since 2025a?) be saved in a pure text format, so I began to wonder if all functions should be written in this style. Turns out that all you have to do is append these lines:
%[appendix]{"version":"1.0"}
%---
to the end of any function file to make it a live function. Doing so changes how MATLAB manages that first comment block. The help command seems to be unaffacted, although [text] may appear at the start of each comment line (depending on if the file was create as a live function or subsequently converted). The doc command behaves very different: instead of bringing up the traditional window for custom documentation, the comment block looks like it gets published to HTML and looks more similar to standard MATLAB help. This is a win in some ways, but the "See also" capabilitity is lost.
Curiously, the same text can be appended to the end of a class definition file with some affect. It does not change how the file shows up in the editor, but as in live functions, comments are published when using the doc command. So we are partway to something like a "live class", but not quite.
Should one stick with traditional *.m files or make everything live? Neither does a great job for functions/classes in a namespace--references must explicitly know absolute location in traditional functions, and there is no "See also" concept in a live function. Do we need a command, like cdoc (custom documentation), that pulls out the comment block, publishing formatted text to HTML while simultaneously resolving "See also" references as hyperlinks? If so, it would be great if there were other special commands like "See examples" that would automatically copy and then open an example script for the end user.
I've been trying this problem a lot of time and i don't understand why my solution doesnt't work.
In 4 tests i get the error Assertion failed but when i run the code myself i get the diag and antidiag correctly.
function [diag_elements, antidg_elements] = your_fcn_name(x)
[m, n] = size(x);
% Inicializar los vectores de la diagonal y la anti-diagonal
diag_elements = zeros(1, min(m, n));
antidg_elements = zeros(1, min(m, n));
% Extraer los elementos de la diagonal
for i = 1:min(m, n)
diag_elements(i) = x(i, i);
end
% Extraer los elementos de la anti-diagonal
for i = 1:min(m, n)
antidg_elements(i) = x(m-i+1, i);
end
end
Digital Twin Development of PEARL Autonomous Surface System Thermal Management
The top session of the countdown showcases how the PEARL engineering team used a digital twin to solve real‑world thermal challenges in a solar‑powered autonomous marine platform operating in extreme environments. After thermal shutdown events in the field, the team built a model that predicts temperatures at multiple locations with ~1% accuracy, while balancing accuracy with model complexity.
Beyond the technology, this keynote delivers practical lessons for predictive modeling and digital twins that apply well beyond marine systems.
We hope you’ve enjoyed the Top 10 countdown series—and a big thank‑you to Olivier de Weck at Massachusetts Institute of Technology, for delivering such a compelling and insightful keynote.
🎥 If you missed it live, be sure to watch the recording to see why it earned the #1 spot at MATLAB EXPO 2026.

MATLAB EXPO India is Back!
This in-person events brings together engineers, scientists, and researchers to explore the latest trends in engineering and science, and discover new MATLAB and Simulink capabilities to apply to your work.
May 7, 2026 l Bengaluru
Register at bit.ly/matlabexpocommunity
Dear all,
Recently I started working on a VS Code-style integrated terminal for the MATLAB IDE.
The terminal is installed as an app and runs inside a docked figure. You can launch the terminal by clicking on the app icon, running the command integratedTerminal or via keyboard shortcut.
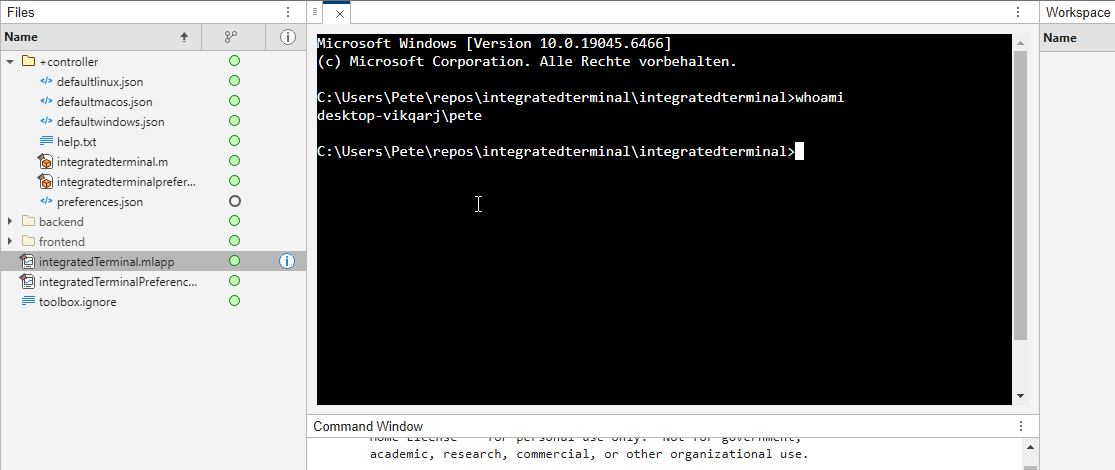
It's possible to change the shell which is used. For example, I can set the shell path to C://Git//bin//bash.exe and use Git Bash on Windows. You can also change the theme. You can run multiple terminals.
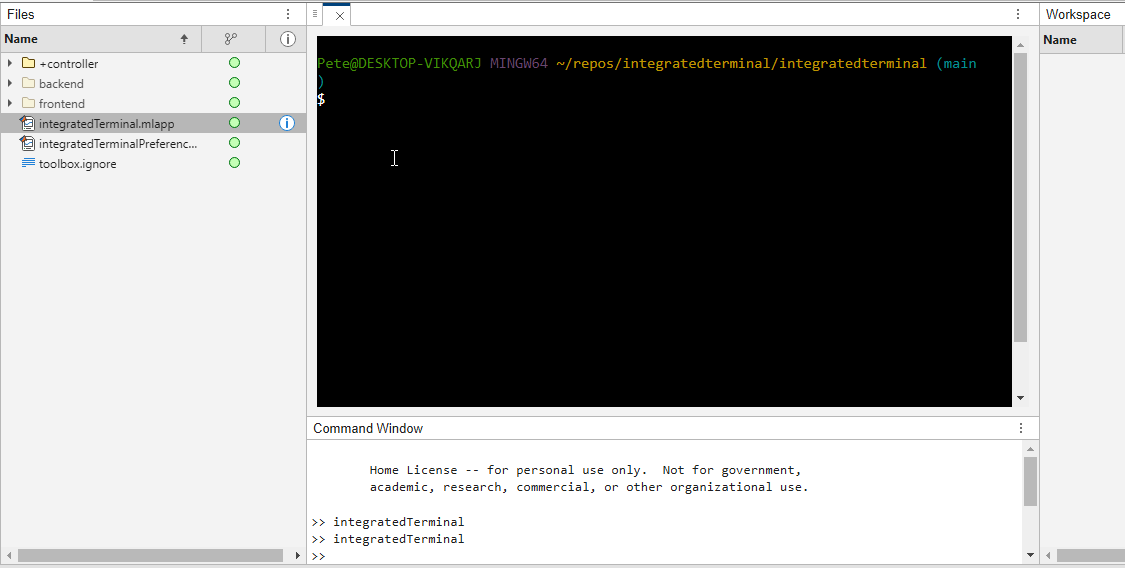
I hope you like it and any feedback will be much appreciated. As soon as it's stable enough I can release it as a toolbox.
Matlab seems to follow a rule that iterative reduction operators give appropriate non-empty values to empty inputs. Examples include,
sum([])
prod([])
all([])
any([])
Is it an oversight not to do something similar for min and max?
max([])
For non-empty A and B,
max([A,B])= max(max(A), max(B))
The extension to B=[] should therefore satisfy,
max(A)=max(max(A),max([]))
for any A, which will only be true if we define max([])=-inf.
Please change the documentation window (https://www.mathworks.com/help/index.html) so I don't have to first click a magnifying glass before I can to get to a text field to enter my search term.
Missed the Cody World Cup Watch Party on March 27—or want to relive the glory?
What you’ll see in the video:
🔥 Top MATLAB users in action
Watch expert solvers think, debug, strategize—and occasionally panic.
Which functions do they reach for? How do they break down the problem?
BEHOLD the power moves… and the 3D arrays.
🏆 Three teams. Six champions. One viciously clever problem.
There may have been NaN traps.
There may have been nested for‑loops.
There may have been… emotions.
🎙️ Professional‑grade commentary by:
@Matt Tearle – Architect of Diabolical Challenges
Their line‑by‑line play‑by‑play turns MATLAB into a true spectator sport.
Finally, tell us what you want to see next—head‑to‑head contests? Team battles? Drop your ideas in the comments. All suggestions welcome!
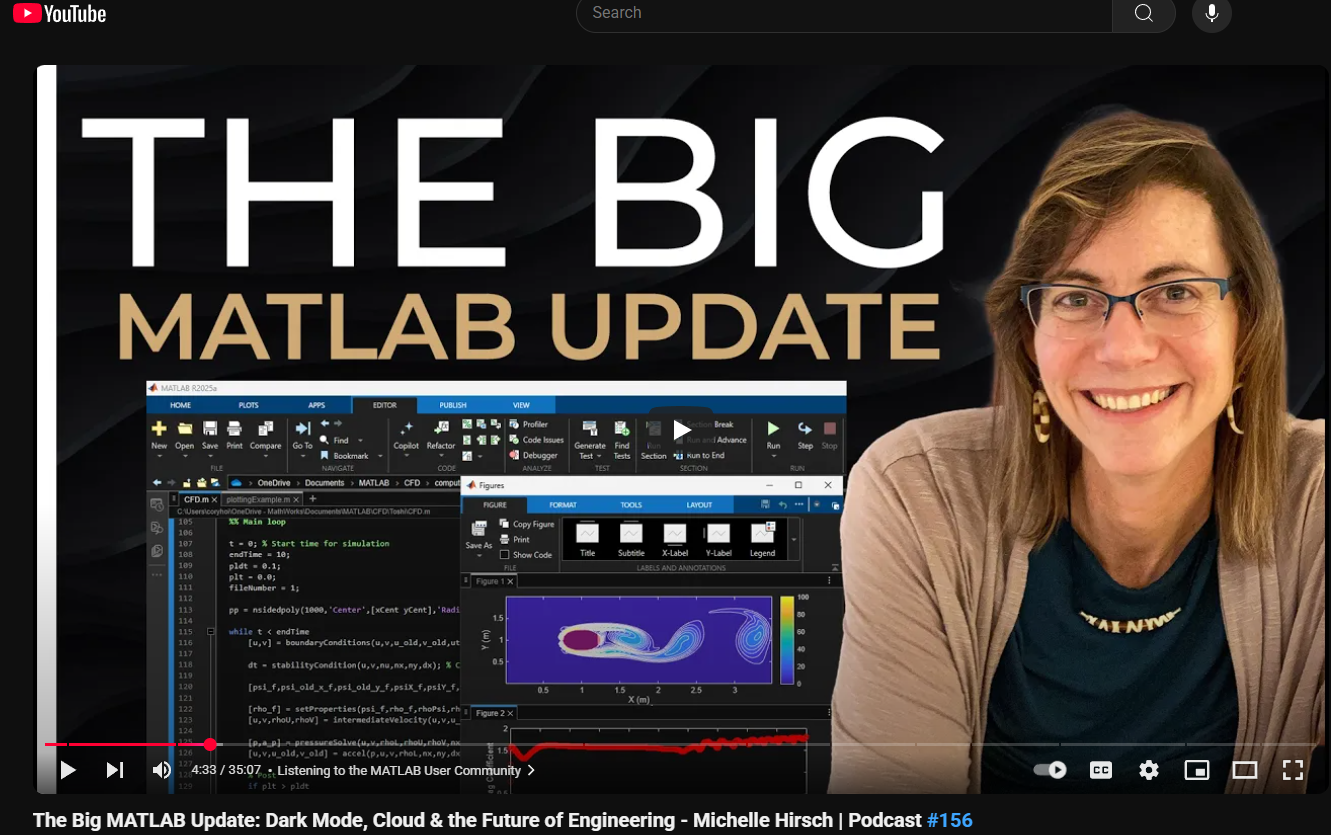
This just came out. @Michelle Hirsch spoke to Jousef Murad and answer his questions about the big change in the desktop in R2025a and explained what was going on behind the scene. Enjoy!
The Big MATLAB Update: Dark Mode, Cloud & the Future of Engineering - Michelle Hirsch
Hello Community,
Registration is now open for the MathWorks Automotive Conference 2026 North America. Join industry leaders and MathWorks experts to learn about the latest trends in:
- Software-defined vehicles
- Generative AI
- Virtual vehicles
- AI and machine learning
Event details
- Date: April 28, 2026
- Location: Saint John’s Resort, Plymouth, MI
This conference is a great opportunity to connect with MathWorks and industry peers—and to explore what’s next in automotive engineering. We encourage you to register today.
We hope to see you there.
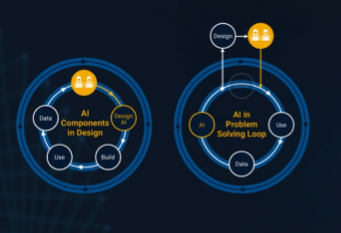
It’s no surprise this keynote landed at #2. MaryAnn Freeman, Senior Director of Engineering, AI, and Data Science explores how AI, especially generative AI, is transforming the way engineers design, build, and innovate. From accelerating the design loop with faster, data‑driven solutions, to blending human creativity with AI insights, to evolving engineering tools that turn ideas into build‑ready systems. This keynote shows how embedded intelligence helps engineers push past traditional limits and bridge imagination with real‑world impact.
If you’re curious about how AI is reshaping engineering workflows today (and what that means for the future of design), this is a must‑watch.
👉 Watch the keynote recording and see why it was one of the most popular sessions of MATLAB EXPO Online 2025.
Absolutely!
65%
Probably
9%
Sometimes yes, sometimes no
4%
Unlikely
17%
Never!
4%
23 voti
PLEASE, PLEASE, PLEASE... make MATLAB Copilot available as an option with a home license.
The 550,000th question has been asked on Answers.
Have you ever wondered what it takes to send live audio from one computer to another? While we use apps like Discord and Zoom every day, the core technology behind real-time voice communication is a fascinating blend of audio processing and networking. Building a simple walkie-talkie is a perfect project for demystifying these concepts, and you can do it all within the powerful environment of MATLAB.
This article will guide you through creating a functional, real-time, push-to-talk walkie-talkie. We won't be building a replacement for a commercial radio, but we will create a powerful educational tool that demonstrates the fundamentals of digital signal processing and network communication.
The Purpose: Why Build This?
The goal isn't just to talk to a colleague across the office; it's to learn by doing. By building this project, you will:
Understand Audio I/O: Learn how MATLAB interacts with your computer’s microphone and speakers.
Grasp Network Communication: See how to send data packets over a local network using the UDP protocol.
Solve Real-Time Challenges: Confront and solve issues like latency, choppy audio, and continuous data streaming.
The Core Components
Our walkie-talkie will consist of two main scripts:
Sender.m: This script will run on the transmitting computer. It listens to the microphone when a key is pressed, sending the audio data in small chunks over the network.
Receiver.m: This script runs on the receiving computer. It continuously listens for incoming data packets and plays them through the speakers as they arrive.
Step 1: Getting Audio In and Out
Before we touch networking, let's make sure we can capture and play audio. MATLAB's built-in audiorecorder and audioplayer objects make this simple.
Problem Encountered: How do you even access the microphone?
Solution: The audiorecorder object gives us straightforward control.
code
% --- Test Audio Capture and Playback ---
Fs = 8000; % Sample rate in Hz
nBits = 16; % Number of bits per sample
nChannels = 1; % Mono audio
% Create a recorder object
recObj = audiorecorder(Fs, nBits, nChannels);
disp('Start speaking for 3 seconds.');
recordblocking(recObj, 3); % Record for 3 seconds
disp('End of Recording.');
% Get the audio data
audioData = getaudiodata(recObj);
% Play it back
playObj = audioplayer(audioData, Fs);
play(playObj);
Running this script confirms that your microphone and speakers are correctly configured and accessible by MATLAB.
Step 2: Sending Voice Over the Network
Now, we need to send the audioData to another computer. For real-time applications like this, the UDP (User Datagram Protocol) is the ideal choice. It’s a "fire-and-forget" protocol that prioritizes speed over perfect reliability. Losing a tiny packet of audio is better than waiting for it to be re-sent, which would cause noticeable delays (latency).
Problem Encountered: How do you send data continuously without overwhelming the network or the receiver?
Solution: We'll send the audio in small, manageable chunks inside a loop. We need to create a UDP Port object to handle the communication.
Here's the basic structure for the Sender.m script:
code
% --- Sender.m ---
% Define network parameters
remoteIP = '192.168.1.101'; % <--- CHANGE THIS to the receiver's IP
remotePort = 3000;
localPort = 3001;
% Create UDP Port object
udpSender = udpport("LocalPort", localPort, "EnablePortSharing", true);
% Configure audio recorder
Fs = 8000;
nBits = 16;
nChannels = 1;
recObj = audiorecorder(Fs, nBits, nChannels);
disp('Press any key to start transmitting. Press Ctrl+C to stop.');
pause; % Wait for user to press a key
% Start the Push-to-Talk loop
disp('Transmitting... (Hold Ctrl+C to exit)');
while true
recordblocking(recObj, 0.1); % Record a 0.1-second chunk
audioChunk = getaudiodata(recObj);
% Send the audio chunk over UDP
write(udpSender, audioChunk, "double", remoteIP, remotePort);
end
And here is the corresponding Receiver.m script:
code
Matlab
% --- Receiver.m ---
% Define network parameters
localPort = 3000;
% Create UDP Port object
udpReceiver = udpport("LocalPort", localPort, "EnablePortSharing", true, "Timeout", 30);
% Configure audio player
Fs = 8000;
playerObj = audioplayer(zeros(Fs*0.1, 1), Fs); % Pre-buffer
disp('Listening for incoming audio...');
% Start the listening loop
while true
% Wait for and receive data
[audioChunk, ~, ~] = read(udpReceiver, Fs*0.1, "double");
if ~isempty(audioChunk)
% Play the received audio chunk
play(playerObj, audioChunk);
else
disp('No data received. Still listening...');
end
end
Step 3: Solving Real-World Hurdles
Running the code above might work, but you'll quickly notice some issues.
Problem 1: Choppy Audio and High Latency
The audio might sound robotic or delayed. This is because of the buffer size and the processing time. Sending tiny chunks frequently can cause overhead, while sending large chunks causes delay.
Solution: The key is to find a balance.
Tune the Chunk Size: The 0.1 second chunk size in the sender (recordblocking(recObj, 0.1)) is a good starting point. Experiment with values between 0.05 and 0.2. Smaller values reduce latency but increase network traffic.
Use a Buffered Player: Instead of creating a new audioplayer for every chunk, we create one at the start and feed it new data. Our receiver code already does this, which is more efficient.
Problem 2: No Real "Push-to-Talk"
Our sender script starts transmitting and doesn't stop. A real walkie-talkie only transmits when a button is held down.
Solution: Simulating this in a script requires a more advanced technique, ideally using a MATLAB App Designer GUI. However, we can create a simple command-window version using a figure's KeyPressFcn.
Here is an improved concept for the Sender that simulates radio push-to-talk, e.g. https://www.retevis.com/blog/ptt-push-to-talk-walkie-talkies-guide
% --- Advanced_Sender.m ---
function PushToTalkSender()
% -- Configuration --
remoteIP = '192.168.1.101'; % <--- CHANGE THIS
remotePort = 3000;
localPort = 3001;
Fs = 8000;
% -- Setup --
udpSender = udpport("LocalPort", localPort);
recObj = audiorecorder(Fs, 16, 1);
% -- GUI for key press detection --
fig = uifigure('Name', 'Push-to-Talk (Hold ''t'')', 'Position', [100 100 300 100]);
fig.KeyPressFcn = @KeyPress;
fig.KeyReleaseFcn = @KeyRelease;
isTransmitting = false; % Flag to control transmission
disp('Focus on the figure window. Hold the ''t'' key to transmit.');
% --- Main Loop ---
while ishandle(fig)
if isTransmitting
% Non-blocking record and send would be ideal,
% but for simplicity we use short blocking chunks.
recordblocking(recObj, 0.1);
audioChunk = getaudiodata(recObj);
write(udpSender, audioChunk, "double", remoteIP, remotePort);
disp('Transmitting...');
else
pause(0.1); % Don't burn CPU when idle
end
drawnow; % Update figure window
end
% --- Callback Functions ---
function KeyPress(~, event)
if strcmp(event.Key, 't')
isTransmitting = true;
end
end
function KeyRelease(~, event)
if strcmp(event.Key, 't')
isTransmitting = false;
disp('Transmission stopped.');
end
end
end
Conclusion and Next Steps
You've now built the foundation of a real-time voice communication tool in MATLAB! You've learned how to capture audio, send it over a network using UDP, and handle some of the fundamental challenges of real-time streaming.
This project is the perfect starting point for more advanced explorations:
Build a Full GUI: Use App Designer to create a user-friendly interface with a proper push-to-talk radio button.
Implement Noise Reduction: Apply a filter (e.g., a simple low-pass or a more advanced spectral subtraction algorithm) to the audioChunk before sending it.
Add Channels: Modify the code to use different UDP ports, allowing users to select a "channel" to talk on.
Informazioni su Discussions
Discussions is a user-focused forum for the conversations that happen outside of any particular product or project.
Get to know your peers while sharing all the tricks you've learned, ideas you've had, or even your latest vacation photos. Discussions is where MATLAB users connect!
Get to know your peers while sharing all the tricks you've learned, ideas you've had, or even your latest vacation photos. Discussions is where MATLAB users connect!
Altre aree comunitarie

MATLAB Answers
Poni e rispondi a domande su MATLAB e Simulink

Scambio di file
Scarica o contribuisci al codice inviato da un utente

Cody
Risolvi problemi, impara ad usare MATLAB e ottieni badge

Blog
Scopri MATLAB e Simulink dall’interno
Area giochi di chat AI
Utilizza l'intelligenza artificiale per generare la bozza iniziale del codice MATLAB e rispondere alle domande!