drise
Syntax
Description
Add-On Required: This feature requires the AI Verification Library for Deep Learning Toolbox add-on.
scoreMap = drise(customDetection,I)
___ = drise(___,
specifies options using one or more name-value arguments in addition to any combination of
input and output arguments from the previous syntaxes.Name=Value)
Examples
Load a YOLO v2 object detector trained to detect vehicles.
s = load("yolov2VehicleDetector.mat");
detector = s.detector;
Read in a test image. This image comes from the Caltech Cars 1999 and 2001 data sets, created by Pietro Perona. The image is used with permission.
img = imread("testCar.png");
img = im2single(img);
Detect vehicles in the test image by using the trained YOLO v2 detector. Pass the test image and the detector as input to the detect function. The detect function returns the bounding boxes and the detection scores.
[bboxes,scores,labels] = detect(detector,img);
figure
annotatedImage = insertObjectAnnotation(img,"rectangle",bboxes,scores);
imshow(annotatedImage)
Use the drise function to create saliency maps explaining the detections made by the YOLO v2 object detector.
scoreMap = drise(detector,img);
Plot the saliency map over the image. Areas highlighted in red are more significant in the detection than areas highlighted in blue.
tiledlayout(1,2,TileSpacing="tight")

for i = 1:2
    nexttile
    annotatedImage = insertObjectAnnotation(img,"rectangle",bboxes(i,:),scores(i));
    imshow(annotatedImage)
    hold on
    imagesc(scoreMap(:,:,i),AlphaData=0.5)
    title("DRISE Map: Detection " + i)
    hold off
end

colormap jet

Load a YOLO v2 object detector pretrained to detect vehicles.
s = load('yolov2VehicleDetector.mat');
detector = s.detector;
Read in a test image. This image comes from the Caltech Cars 1999 and 2001 data sets, created by Pietro Perona. The image is used with permission.
img = imread("testCar.png");
img = im2single(img);
Specify the target detections you want to understand.
targetBbox = [125 64 116 85];
targetLabel = 1;
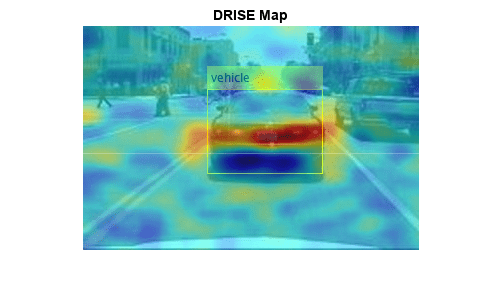
Use the drise function and the target bounding boxes and labels to create saliency maps explaining the detections made by the YOLO v2 object detector.
scoreMap = drise(detector,img,targetBbox,targetLabel);
Plot the saliency map over the image. Areas highlighted in red are more significant in the detection than areas highlighted in blue.
figure
annotatedImage = insertObjectAnnotation(img,"rectangle",targetBbox,"vehicle");
imshow(annotatedImage)
hold on
imagesc(scoreMap,AlphaData=0.5)
title("DRISE Map")
hold off
colormap jet
Load a YOLO v2 object detector pretrained to detect vehicles.
s = load('yolov2VehicleDetector.mat');
detector = s.detector;
Read in a test image. This image comes from the Caltech Cars 1999 and 2001 data sets, created by Pietro Perona. The image is used with permission.
img = imread("testCar.png");
img = im2single(img);
Detect vehicles in the test image by using the trained YOLO v2 detector. Pass the test image and the detector as input to the detect function. The detect function returns the bounding boxes and the detection scores.
[bboxes,scores,labels] = detect(detector,img);
figure
annotatedImage = insertObjectAnnotation(img,"rectangle",bboxes,scores);
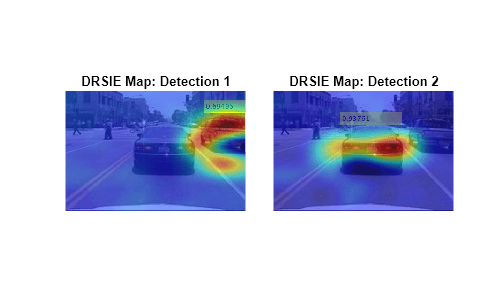
imshow(annotatedImage)Use the drise function to create saliency maps explaining the detections made by the YOLO v2 object detector. To increase the number of mask images that the function uses to generate the saliency maps, set the number of samples to 16,384. Use a mask resolution of 8-by-8 pixels and a mask probability of 0.85. With the increase in the number of samples, the drise function takes longer to run. To track the progress, return the verbose output.
scoreMap = drise(detector,img, ...
    NumSamples=16384, ...
    MaskResolution=[8 8], ...
    MaskProbability=0.85, ...
    MiniBatchSize=256, ...
    Verbose=true);
Computing target detections...Explaining 2 detections.
Number of mini-batches to process: 64
..........   ..........   ..........   ..........   .......... (50 mini-batches)
..........   ....                                              (64 mini-batches)
Total time = 34.2 seconds.
Plot the saliency map over the image. Areas highlighted in red are more significant in the detection than areas highlighted in blue.
tiledlayout(1,2,TileSpacing="tight")
for i = 1:2
nexttile
annotatedImage = insertObjectAnnotation(img,"rectangle",bboxes(i,:),scores(i));
imshow(annotatedImage)
hold on
imagesc(scoreMap(:,:,i),AlphaData=0.5)
title("DRSIE Map: Detection " + i);
hold off
end
colormap jet
Load a YOLO v2 object detector pretrained to detect vehicles.
s = load("yolov2VehicleDetector.mat");
detector = s.detector;
Read in a test image. This image comes from the Caltech Cars 1999 and 2001 data sets, created by Pietro Perona. The image is used with permission.
img = imread("testCar.png");
img = im2single(img);
You can create saliency maps for an object detector that you call using a function handle. The function handle must take exactly one input argument, which is the image, and return exactly three output arguments: the bounding boxes, the class probabilities, and the objectness score.
Modify the YOLO v2 detector to create a custom detector. You can use the function handle input to specify additional name-value arguments to the detect method. Return all detected bounding boxes by setting SelectStrongest to false.
function [bboxes,classProbs,objectness] = customDetector(detector,img)

[bboxes,~,~,intermediates] = detect(detector,img,SelectStrongest=false);

if isa(intermediates,"cell")
    classProbs = cellfun(@(x)getFields(x,"ClassProbabilities"), ...
        intermediates,UniformOutput=false);

    objectness = cellfun(@(x)getFields(x,"ObjectnessScores"), ...
        intermediates,UniformOutput=false);
else
    classProbs = intermediates.ClassProbabilities;
    objectness = intermediates.ObjectnessScores;
end
end

function z = getFields(x,fieldName)
if ~isempty(x)
    z = x.(fieldName);
else
    z = [];
end
end
Specify target detections to understand. For a function handle input, you must specify a numeric value corresponding to the index of the class label.
targetBbox = [125 64 116 85];
targetLabel = 1;
Generate the saliency map.
scoreMap = drise(@(img)customDetector(detector,img),img,targetBbox,targetLabel);
Plot the results.
figure
annotatedImage = insertObjectAnnotation(img,"rectangle",targetBbox,"vehicle");
imshow(annotatedImage)
hold on
imagesc(scoreMap,AlphaData=0.5)
title("DRISE Map: Custom Detector")
hold off
colormap jet

Input Arguments
Name-Value Arguments
Output Arguments
References
[1] Petsiuk, Vitali, Rajiv Jain, Varun Manjunatha, Vlad I. Morariu, Ashutosh Mehra, Vicente Ordonez, and Kate Saenko. “Black-Box Explanation of Object Detectors via Saliency Maps.” Preprint, submitted June 10, 2021. https://arxiv.org/abs/2006.03204.
Version History
Introduced in R2024a
See Also
Functions
detect(Computer Vision Toolbox) |gradCAM|imageLIME|occlusionSensitivity
Objects
yolov2ObjectDetector(Computer Vision Toolbox) |yolov3ObjectDetector(Computer Vision Toolbox) |yolov4ObjectDetector(Computer Vision Toolbox) |yoloxObjectDetector(Computer Vision Toolbox)
Topics
- Object Detection Using YOLO v2 Deep Learning (Computer Vision Toolbox)
- Grad-CAM Reveals the Why Behind Deep Learning Decisions