Simulink Editor
Create models and set model properties
Description
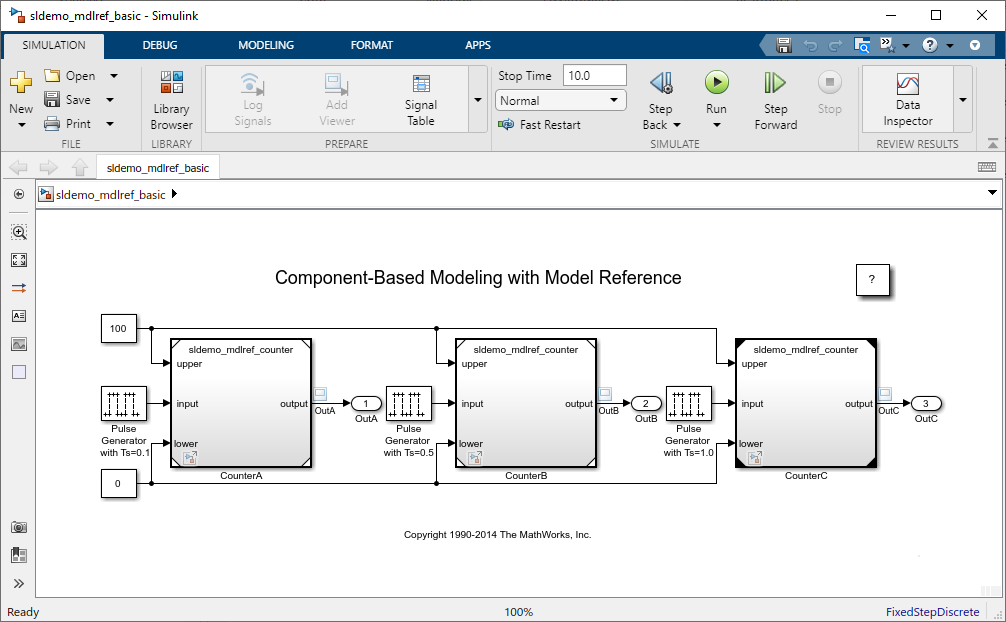
The Simulink® Editor allows you to create and configure system models.
The Simulink Editor is a tool for building models. In addition to providing standard methods for working with diagrams in a vector graphics editor, the editor provides shortcuts that help you to add and connect blocks. The Simulink Editor also gives you access to the tools you need for technical operations such as importing data, simulating your model, and analyzing model performance.
Open the Simulink Editor
Create a model. On the MATLAB® Home tab, click Simulink and choose a model template.
Alternatively, if you already have the Library Browser open, click the New Model button
 .
.Open an existing model. To open recent models, on the MATLAB Home tab, click Simulink.
Alternatively, if a model is on the MATLAB path, enter the model name in the MATLAB Command Window. For example, suppose you want to open
myModel.slx. To open the model, in the command window, entermyModel.
Tip
The first model that you open in a MATLAB session takes longer to open than subsequent models. By default, MATLAB does not start Simulink until you open the first model to reduce MATLAB startup time and avoid unnecessary system memory use.
To speed up opening the first model, you can configure MATLAB startup to also start Simulink. For more information on how to start Simulink without opening models or the Library Browser, see the start_simulink reference page.
Examples
When you build a model in the Simulink Editor, you use common techniques for working with graphics objects.
Actions you can perform in the Simulink Editor include:
Selecting using click, shift-click, and dragging
Resizing objects using handles and moving objects by dragging
Cutting, copying, and pasting
Undoing and redoing up to 101 operations
Note
After you undo or redo block parameter changes, a visual cue appears that shows the current values of the affected parameters. Some parameter changes are not affected by the undo or redo commands. After you undo or redo changes to block parameters, use the cue to see the parameters affected.
A small subset of parameters cannot be undone. Changing these parameters clears the undo history when you make the change in the Property Inspector or in the block dialog box.
You can also zoom and scroll the editing area. On the Modeling tab, select Environment > Zoom, and select the zoom or view you want to use. If you are using a supported touch display platform, you can pinch to zoom and swipe to scroll. The supported touch display devices include Microsoft® Windows® platforms with a Windows 7 certified or Windows 8 certified touch display and Macintosh platforms with an Apple Magic Trackpad.
The editor supports additional shortcuts for scrolling that are unique to Simulink. Shortcuts and other interactive model building techniques are summarized in Keyboard Shortcuts and Mouse Actions for Simulink Modeling.
The Simulink Editor can provide you with visual cues for some model design issues. Highlighted blocks alert you to issues. To see a description of the issue, pause on a highlighted block and click the error or warning symbol.

Similar to the Diagnostic Viewer, if an error or warning has a predefined fix, the notification dialog box lists actions and may include a Fix button to apply these changes.
Simulink can detect block errors and warnings, such as:
Goto and From block mismatches.
Duplicate data store blocks. The value of the Duplicate data store names parameter determines whether to display a warning or an error symbol.
The Errors and Warnings option is enabled by default. To turn off this option, in the Debug tab, select Diagnostics > Edit-Time Errors & Warnings.
Use the Model Browser to navigate a model hierarchy using a tree structure. The browser helps you to understand the organization of your model and explore systems within systems.
To display the Model Browser, in the Simulink Editor, in the Modeling tab, select Environment > Model Browser. You can toggle the Model Browser display by clicking the
Hide/Show Model Browser control ![]() .
.

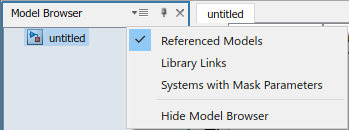
In the Model Browser, you can specify whether to display blocks that are linked to a
library or to masked subsystems. Click ![]() and select Library Links or
Systems with Mask Parameters. For information on these
types of blocks, see Linked Blocks and Masking Fundamentals.
and select Library Links or
Systems with Mask Parameters. For information on these
types of blocks, see Linked Blocks and Masking Fundamentals.
As you build a model, you can set parameters and properties on model elements. For example, you can set parameters and properties for blocks that affect how the block functions. You can also set properties on Stateflow® charts, signal lines, visual elements such as annotations, and on the model.
Based on your workflow and goals, set parameters and properties using:
The Property Inspector, which stays open in the editor as you work and updates based on the current selection
A dialog box that is associated with an element, such as a specific block
The Model Data Editor, which stays open and displays information about signals, states, and algorithmic block parameters (for instances, gains and filter coefficients) in a table
For blocks whose parameter value appears on the block icon, you can select the block, pause on the value, and edit the value directly. For more information, see Edit Block Parameters.
Related Examples
Parameters
Programmatic Use
Version History
Introduced before R2006aThe Simulink Toolstrip contains components that were previously available in menus and toolbars. To support common user workflow tasks, new tabs called Simulation, Debug, Modeling, Format, and Apps provide functionality corresponding to each task.

The Apps tab provides a gallery of applications from the Simulink family of products. Apps may open a new contextual tab, a separate window, or they may be a shortcut to the configuration parameters.
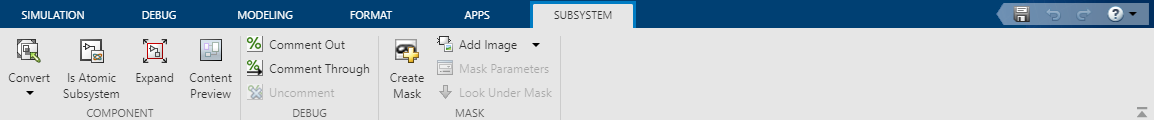
When you select a model component, a contextual tab activates, displaying the tools to assist you in a step in your workflow. For example, when you select a subsystem block, the Subsystem tab appears. If you select a Stateflow chart, the State Chart tab appears. When the block or chart is no longer selected, the contextual tabs disappear.
The quick access toolbar contains frequently used options such as save, undo, and redo.
![]()
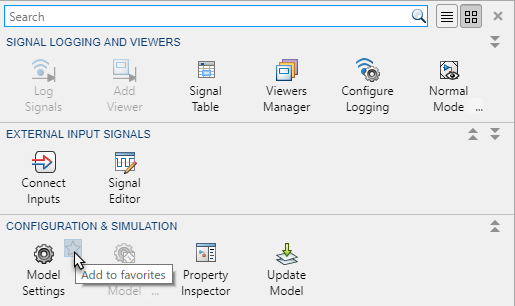
After opening a gallery, you can mark buttons as favorites. Buttons that are favorites appear at the top of the gallery for quicker access.
The following tables list the new Simulink Toolstrip items that are different from the Simulink Editor menu bar items. Many of the features and options that were previously hidden within the toolbar menus are now directly available from tabs on the Simulink Toolstrip.
File Menu
| Menu Bar Item | Toolstrip Equivalent |
|---|---|
New >
| Simulation > New >
|
Open (Ctrl+O) | Simulation > Open (Ctrl+O) |
Open Recent | Simulation > Open > Recent Files. |
Save (Ctrl+S) | Simulation > Save (Ctrl+S) |
Save as | Simulation > Save > Save as |
Project > Create Project from Model | Simulation > New > Project > New Project from this Model |
Project >
| Open your project. Simulation > Project >
|
Export Model to >
| Simulation > Save >
|
Reports > System Design Description | Modeling > Design Gallery > System Design Report |
Reports > System Requirements | Apps > Requirements Manager > Share > Generate Model Traceability Report |
Model Properties > Model Properties | Modeling > Model Settings > Model Properties |
Model Properties > Link to Data Dictionary | Modeling > Design Gallery > Link to Data Dictionary |
Model Properties >
| Open your Stateflow chart. Modeling > Chart Properties >
|
Link to Data Dictionary | Modeling > Model Settings > Model Properties > Data tab |
Print >
| Simulation > Print >
|
| Simulink Preferences | Modeling > Environment > Simulink Preferences |
Stateflow Preferences >
| Open your Stateflow chart. Format > Style >
|
Exit MATLAB (Ctrl+Q) | Exit MATLAB from MATLAB |
Edit Menu
| Menu Bar Item | Toolstrip Equivalent |
|---|---|
Undo (Ctrl+Z) | (Ctrl+Z) |
Redo (Ctrl+Y) | (Ctrl+Y) |
Cut (Ctrl+X) | (Ctrl+X) |
Copy (Ctrl+C) | (Ctrl+C) |
Copy Current View to Clipboard >
| Format > Screenshot
|
Paste (Ctrl+V) | (Ctrl+V) |
Paste Duplicate Inport | Right-click, and then click the Paste Duplicate Inport button
|
Select All (Ctrl+A) | (Ctrl+A) |
Comment Through (Ctrl+Shift+Y) | Debug > Comment Through
|
Comment Out (Ctrl+Shift+X) | Debug > Comment Out
|
Delete | Use the Delete key. |
Find | Modeling > Find
|
Find Referenced Variables | Modeling > Find > Find Ref Variables |
Find & Replace in Chart | Open your Stateflow chart. Modeling > Find > Find & Replace in Chart |
Bus Editor | Modeling > Design Gallery > Bus Editor |
Lookup Table Editor | Modeling > Design Gallery > Lookup Table Editor |
View Menu
| Menu Bar Item | Toolstrip Equivalent |
|---|---|
Library Browser | Simulation > Library Browser
|
Model Explorer > Model Explorer | Modeling > Design Gallery > Model Explorer |
Model Explorer >
| Modeling > Design Gallery >
|
Variant Manager | Modeling > Design Gallery > Variant Manager |
Project | Open your project. Simulation > Project > View Project |
Model Dependency Viewer >
| Modeling > Design > Model Dependencies >
|
Diagnostic Viewer | Debug > Diagnostics > Diagnostic Viewer
|
Schedule Editor | Modeling > Design Gallery > Schedule Editor |
Requirements at This Level
| Right-click the canvas. Requirements at This Level >
|
Model Browser > Show Model Browser | Modeling > Environment > Model Browser |
Model Browser >
| Modeling > Environment > Model Browser >
|
Property Inspector | Modeling > Design Gallery > Property Inspector (Ctrl+Shift+I) |
Notes | Modeling > Design Gallery > Notes (Ctrl+Shift+N) |
Model Data Editor | Modeling > Design Gallery > Model Data Editor (Ctrl+Shift+E) |
Viewmarks > Viewmark This View | Simulation > Save > Save Viewmark |
Viewmarks > Show Viewmarks | Simulation > Open > Open Viewmarks |
Configure Toolbars | Modeling > Environment > Simulink Preferences |
Toolbars | Modeling > Environment > Toolstrip |
Status Bar | Modeling > Environment > Status Bar |
Explorer Bar | Modeling > Environment > Explorer Bar |
Navigate >
| Use the navigation arrows |
Navigate > Previous Tab | (Ctrl+Shift+Backtab) |
Navigate > Next Tab | (Ctrl+Tab) |
Zoom >
| Modeling > Environment> Zoom >
|
Smart Guides | Modeling > Environment > Smart Guides |
Display Menu
| Menu Bar Item | Toolstrip Equivalent |
|---|---|
Interface | Modeling > Design Gallery > Model Interface |
Library Links >
| Debug > Information Overlays
|
Sample Time >
| Debug > Information Overlays
|
Function Connectors | Debug > Information Overlays
|
Blocks >
| Debug > Information Overlays
|
Blocks > Tool Tip Options >
| Debug > Information Overlays
|
Errors & Warnings | Debug > Diagnostics > Edit-Time Errors & Warnings |
Signals & Ports >
| Debug > Information Overlays
|
Simscape >
| Debug > Information Overlays
|
Simscape >
| Debug > Output Values >
|
Data Display in Simulation >
| Debug > Output Values >
|
Stateflow Animation | See Stateflow Release Notes. |
Highlight Signal to Source | Debug > Trace Signal > Trace to Source
|
Highlight Signal to Destination | Debug > Trace Signal > Trace to Destination
|
Remove Highlighting | Debug > Trace Signal > Remove trace
|
Hide Automatic Names | Select the block(s). Block > Name
|
Hide Markup | Format > Show Markup
|
Diagram Menu
| Menu Bar Item | Toolstrip Equivalent |
|---|---|
Refresh Blocks | Modeling > Update Model > Refresh Blocks
|
Subsystem & Model Reference > Create Subsystem from Selection | Select the blocks to create a subsystem. Multiple > Create Gallery > Create Subsystem |
Subsystem & Model Reference > Expand Subsystem | Select the subsystem. Subsystem > Expand
|
Subsystem & Model Reference > Convert to >
| Select the subsystem. Subsystem > Convert >
|
Subsystem & Model Reference > Model Block Normal Mode Visibility | Simulation > Prepare Gallery > Normal Mode Visibility |
Subsystem & Model Reference > Refresh Selected Model Block | Select the Model block. Model Block > Refresh |
Subsystem & Model Reference > Create Protected Model for Selected Model Block | Select the Model block. Model Block > Protect |
Format > Font Style | Format |
Format > Text Alignment | Double-click the text. Use the pop-up menu. |
Format >
| Format >
|
Rotate & Flip >
| Select the block. Format >
|
Arrange >
| Format >
|
Mask >
| Select the block. Block >
|
Mask > Create Model Mask | Modeling > Component Gallery > Create Model Mask |
Library Link >
| Select a library linked block. Subsystem >
|
Signal & Ports >
| Simulation > Prepare Gallery apps |
Signals & Ports >
| Right-click block. Signals & Ports >
|
Signal & Ports > Signal Hierarchy | Click signal. Signal > Signal Hierarchy |
Block Parameters | Right-click block. Block Parameters |
Properties | Right-click a block, and then click the Properties button
|


Simulation Menu
| Menu Bar Item | Toolstrip Equivalent |
|---|---|
Update Diagram | Modeling > Update Model (Ctrl+D) |
Model Configuration Parameters | Modeling > Model Settings |
Mode >
| Simulate >
|
Mode >
| Apps > SIL/PIL Manager > SIL/PIL
|
Mode > External | A Hardware tab will appear to the left of the Apps tab for all models configured to run on hardware. To configure your system to be run on hardware, in the Modeling tab, click Model Settings. In the Hardware Implementation pane of the Configuration Parameters, choose your hardware board from the dropdown list. Once your hardware board is selected, open the Target hardware resources options and under Groups choose External Mode. |
Data Display >
| Debug > Output Values >
|
Stateflow Animation >
| Open your Stateflow chart. Debug > Animation Speed >
|
Fast Restart | Simulation > Fast Restart
|
Step Back | Simulation > Step Back
|
Run | Simulation > Run
|
Pacing Options | Simulation > Run > Simulation Pacing
|
Step Forward | Simulation > Step Forward
|
Stop | Simulation > Stop
|
Output >
| Simulation > Review Results Gallery >
|
Output >
| Simulation > Prepare Gallery
|
Stepping Options > | Simulation > Step Back > Configure simulation
stepping
|
Debug >
| Debug >
|
Debug > Stateflow Breakpoints and Watch Window | Open your Stateflow chart. Debug > Breakpoints List
|
Debug > Simulation Target for MATLAB and Stateflow | Modeling > Model Settings > Simulation Target |
Debug >
| Open your Stateflow chart. Debug >
|
Debug > MATLAB and Stateflow Error Checking Options > Detect Cycles | Debug > Diagnostics > Detect Cyclical Behavior |
Analysis Menu
| Menu Bar Item | Toolstrip Equivalent |
|---|---|
Model Advisor >
| Modeling > Model Advisor
|
Metrics Dashboard | Apps > Metrics Dashboard |
Refactor Model >
| Apps >
|
Refactor Model > Model Transformer | Apps > Model Transformer |
Model Slicer | Apps > Model Slicer |
Model Dependencies > Model Dependency Viewer >
| Modeling > Design Gallery > Model Dependencies |
Model Dependencies
| Modeling > Compare
|
Compare To | Modeling > Compare > Compare Models
|
Simscape >
| Apps >
|
Performance Tools >
| Debug > Performance Advisor >
|
Requirements >
| Apps > Requirements Manager >
|
Requirements > Reports >
| Apps > Requirements Manager >
|
Requirements > Requirements at This Level >
| Right-click the canvas. Requirements at This Level >
|
Requirement > Links File >
| Apps > Requirements Manager >
|
Requirements > Settings | Apps > Requirements Viewer > Link Settings |
Control Design >
| Apps >
|
Control Design > Linear Analysis Points >
| Right-click signal. Apps > Linearization Manager >
|
Parameter Estimation | Apps > Parameter Estimator |
Response Optimization | Apps > Response Optimizer |
Sensitivity Analysis | Apps > Sensitivity Analyzer |
Test Harness >
| Apps > Simulink Test >
|
Observers >
| Right-click the canvas. Observers >
|
Test Manager | Apps > Simulink Test > Simulink Test Manager |
Design Verifier
| Apps > Design Verifier >
|
Design Verifier > Model Slicer | Apps > Model Slicer |
Coverage > Open Results Explorer
| Apps > Coverage Analyzer >
|
Data Type Design >
| Apps >
|
Code Menu
| Menu Bar Item | Toolstrip Equivalent |
|---|---|
C/C++ Code > Code Generation Report >
| These options can be found by using Embedded Coder, Simulink Coder, or the AUTOSAR Component Designer. The path is shown using Embedded Coder. For Simulink Coder or AUTOSAR Component Designer, select those apps from the Apps gallery. Apps > Embedded Coder > C Code >
|
C/C++ Code >
| These options can be found by using Embedded Coder, Simulink Coder, or the AUTOSAR Component Designer. The path is shown using Embedded Coder. For Simulink Coder or AUTOSAR Component Designer, select those apps from the Apps gallery. Apps > Embedded Coder > C Code >
|
C/C++ Code > Build Selected Subsystem | Right-click the subsystem. C/C++ Code > Build This Subsystem |
C/C++ Code >
| Right-click the function or S-function. C/C++ Code >
|
HDL Code >
| Apps > HDL Coder > HDL Code >
|
PLC Code >
| Apps > PLC Coder > PLC Code >
|
Data Objects >
| Modeling > Design Gallery >
|
External Mode Control Panel | Apps > Run on Custom Hardware > Hardware > Prepare Gallery > Control Panel |
Simulink Code Inspector | Apps > Code Inspector |
Verification Wizards >
| Apps >
|
Polyspace >
| Apps > Polyspace Code Verifier >
|
DO Qualification Kit >
| Apps > DO Qualification Kit >
|
DO Qualification Kit > Qualification Tests
| Apps > DO Qualification Kit > Run Qualification Tests
|
IEC Certification Kit >
| Apps > IEC Certification Kit >
|
IEC Certification Kit > Validation Tests >
| Apps > IEC Certification Kit > Run Validation Tests
|
Tools Menu
| Menu Bar Item | Toolstrip Equivalent |
|---|---|
Library Browser | Simulation > Library Browser
|
Model Explorer | Modeling > Design Gallery > Model Explorer |
Report Generator | Apps > Report Generator |
Requirements Editor | Apps > Requirements Manager > Requirements Editor
|
MPlay Video Viewer | Apps > Video Viewer |
Robot Operating System >
| Open your ROS model. Simulation > Prepare Gallery >
|
Simulink Real-Time | Apps > Simulink Real-Time |
Run on Target Hardware >
| Apps >
|
SoC Builder | Open your SoC project. System on Chip > Configure, Build & Deploy |
Help | Use the quick access toolbar |