Analisi nel dominio del tempo e nel dominio della frequenza
R2026aI comandi di analisi nel dominio del tempo e nel dominio della frequenza consentono di calcolare e visualizzare le risposte dei sistemi SISO e MIMO, come i grafici di Bode, i grafici di Nichols, le risposte al gradino e le risposte all'impulso. È inoltre possibile estrarre le caratteristiche del sistema come il tempo di salita e di assestamento, l'overshoot e i margini di stabilità. Per come iniziare a utilizzare le risposte di plottaggio, vedere Plotting System Responses. Per ulteriori informazioni sulla personalizzazione dei grafici di risposta, vedere Personalizzazione del grafico.
Funzioni
App
| Linear System Analyzer | Analyze time-domain and frequency-domain responses of linear time-invariant (LTI) systems |
Strumenti
| Linear Simulation Tool | Specify input signals and initial conditions for simulating linear models with arbitrary input signals and initial conditions |
Attività di Live Editor
| Creazione del grafico | Interactively create linear analysis response plots in the Live Editor (Da R2022b) |
Blocchi
 | LTI System | Utilizzare l'oggetto del modello del sistema a tempo lineare invariante in Simulink |
Argomenti
Nozioni di base sui grafici di analisi
- Plotting System Responses
This example shows an overview of generating time-domain and frequency-domain response plots.
Analisi nel dominio del tempo
- Time-Domain Responses
Generate and visualize time-response data such as step response and impulse response.
- Time-Domain Characteristics on Response Plots
Visualize time-domain system characteristics such as settling time and overshoot on response plots. - Numeric Values of Time-Domain System Characteristics
Use thestepinfofunction to obtain numeric values of step response characteristics such as rise time, settling time, and overshoot.
Analisi nel dominio della frequenza
- Frequency-Domain Responses
Generate and visualize frequency-response data such as Bode plots and Nichols plots.
- Frequency-Domain Characteristics on Response Plots
Visualize frequency-domain system characteristics such as peak response on plots. - Numeric Values of Frequency-Domain Characteristics of SISO Model
Obtain numeric values of frequency-domain characteristics such as peak gain, dc gain, and system bandwidth.
Linear System Analyzer
- Joint Time-Domain and Frequency-Domain Analysis
Compare multiple types of responses side by side, including both time-domain and frequency-domain responses, using the Linear System Analyzer app. - Analyzing MIMO Models
In analysis plots of multiple-input, multiple output LTI models, there are plot tools for selecting subsystems and grouping I/O pairs.
Sistemi con ritardi temporali
- Analyze Dynamic Systems with Time Delays
The time and frequency responses of delay systems can have features that can look odd to those only familiar with delay-free LTI analysis. - Analyze Control Systems with Delays
Many processes involve dead times, also referred to as transport delays or time lags. Controlling such processes is challenging because delays cause phase shifts that limit the control bandwidth and affect closed-loop stability. - Validate Simulation Results for Models with Internal Delays
Validate the accuracy of simulations with internal delays by varying sample time. (Da R2026a)
Informazioni complementari
Esempi in primo piano
Analisi della risposta di un circuito RLC
Analizzare le risposte di frequenza e di tempo di un sistema del secondo ordine.
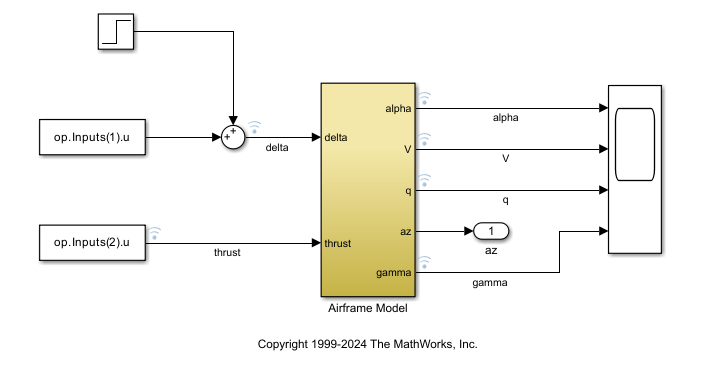
Use Linearization Offsets to Help Compare Nonlinear and Linearized Responses
Use offsets from linearization to facilitate the comparison of the nonlinear and linearized responses of a Simulink model.
Risorse didattiche

Analisi della funzione di trasferimento di sistemi dinamici
Scoprire come calcolare le funzioni di trasferimento e come utilizzare poli, zeri e grafici di Bode per analizzarle.

